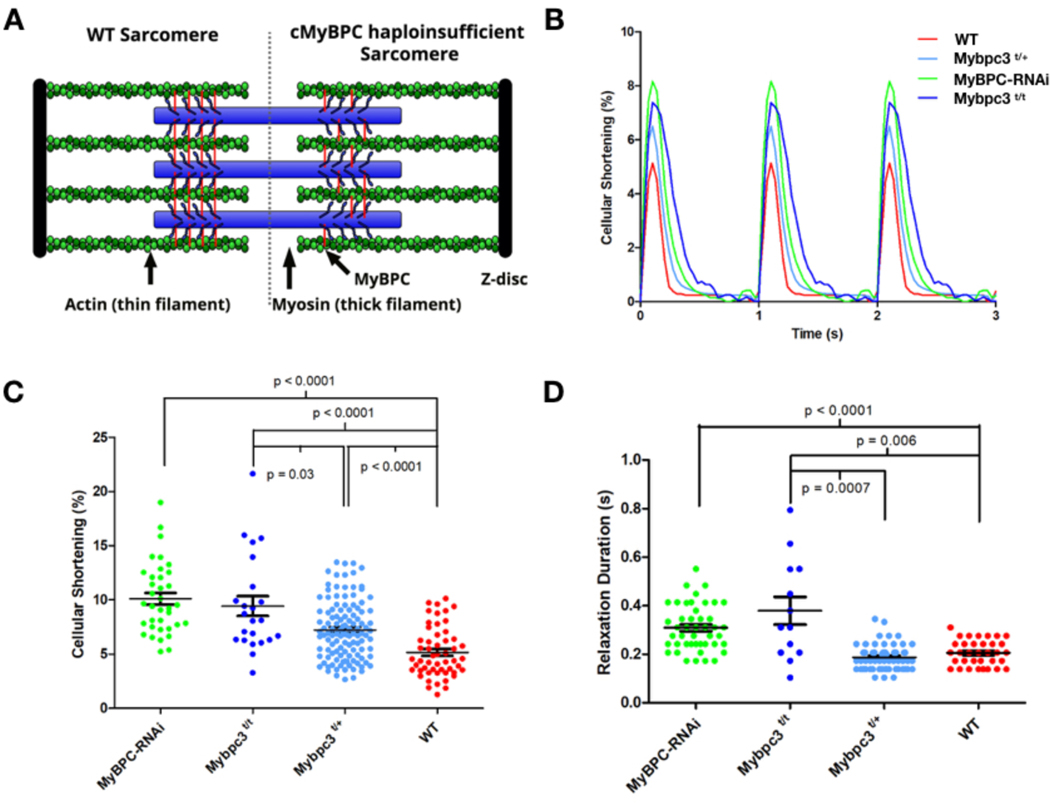
Figure 1: Contractile characterization of cMyBPC mouse models.
A) A schematic depiction of the WT sarcomere with normal cMyBPC integration (left half) and the consequences of mutations that deplete cMyBPC quantities in the sarcomere (right half). B) Representative contractile waveforms from isolated cardiomyocytes paced at 1Hz. Sarcomere lengths of isolated cardiomyocytes were tracked to define the percentage shortening per cell and duration of relaxation. Each trace is the averaged waveform across all cells analyzed for each treatment group. C) Comparisons of cellular shortening of isolated cardiomyocytes from four mice with different genotypes. (Cells analyzed: MyBPC-RNAi = 36; Mybpc3t/t = 23; Mybpc3t/+ = 118,WT= 53.) Data is plot as mean ± SEM. D) Measures of duration from peak contraction to relaxation in seconds plot as mean ± SEM (Cells analyzed: MyBPC-RNAi = 34; Mybpc3t/t = 13; Mybpc3t/+= 61,WT = 30).

