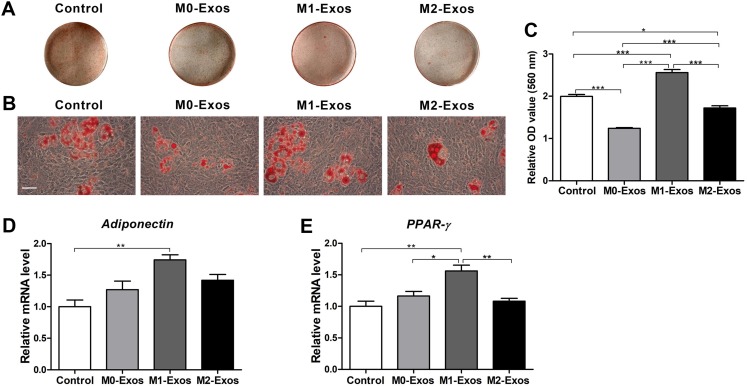
Figure 5. Adipogenic potential of the BMMSCs in response to exosome-based incubation (control: cells in normal adipogenic cultures); BMMSCs were incubated in normal adipogenic medium supplemented with exosomes (M0-Exos, M1-Exos or M2-Exos).
(A) General view of the Oil red O-stained lipid droplets after 7 days of adipogenic induction. (B) Representative images of Oil red O staining captured under the microscope (scale bar: 100 μm). (C) Quantitative analysis results of the lipid droplets. (D and E) Relative mRNA expression levels of adipogenesis-related genes (adiponectin and PPAR-γ) in the BMMSCs (qRT-PCR assay results). Values were normalized to β-Actin and relative to the level of the control. Data are presented as the mean ± SD; n = 3; *p < 0.05, **p < 0.01 and ***p < 0.001 indicate significant differences between the indicated columns.

