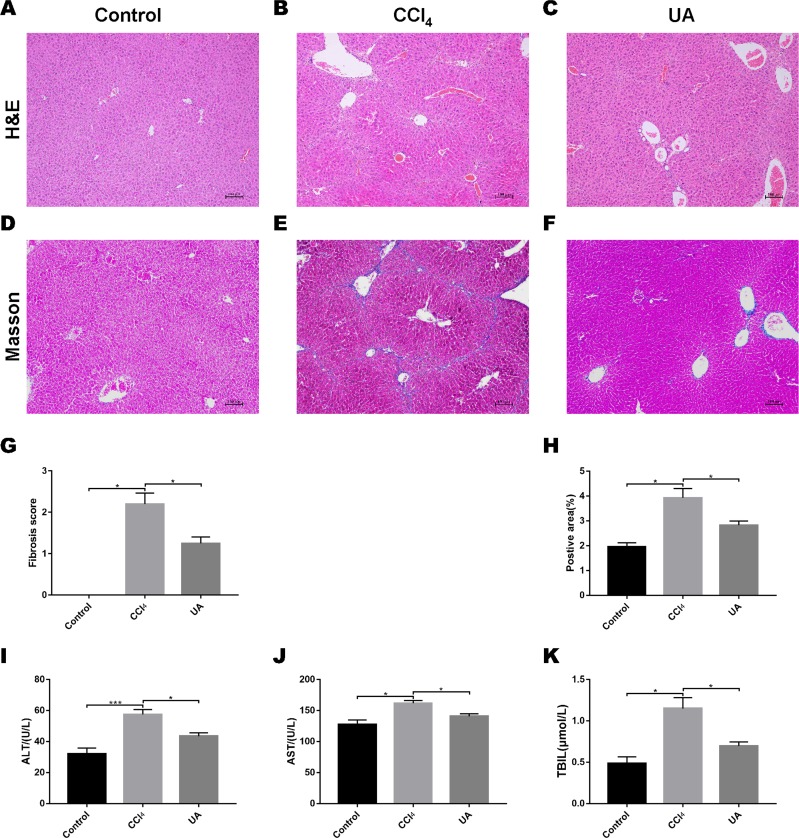
Figure 1. Effect of UA on liver injury and fibrosis in mice with liver fibrosis.
(A–C) Haematoxylin-eosin (H&E) staining (100×). (D–F) Masson’s trichrome staining (100×). (G–H) Histological analysis of the fibrotic score and area. (I–K) Liver function serum index. Data represent the mean ± SD of values per group. ∗P < 0.05 and ∗∗∗P < 0.001.

