
Figure 1: Sugar activates the gut-brain axis.
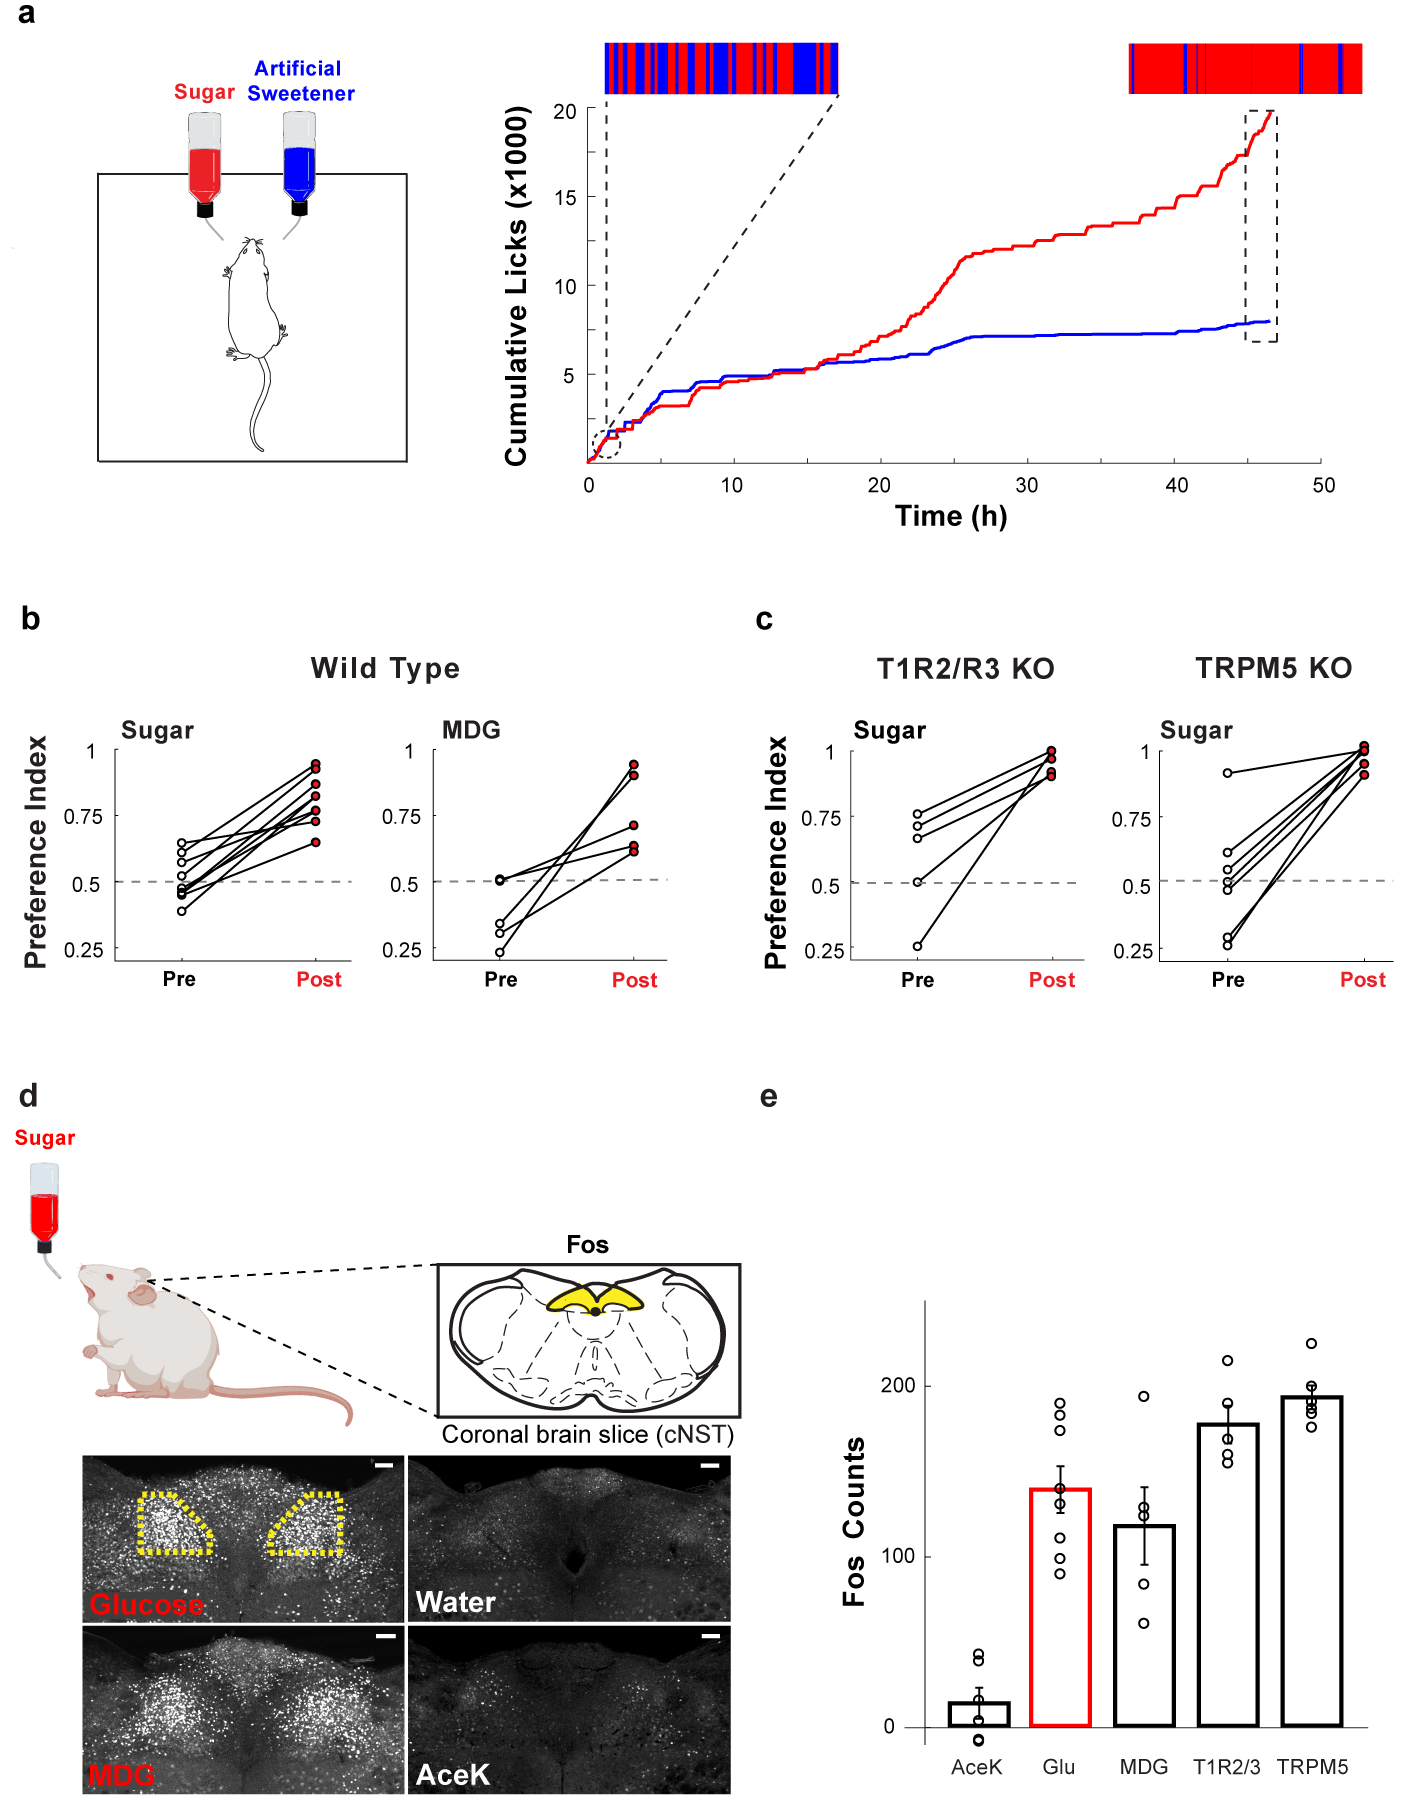
a, Mice are given a choice between 600 mM glucose or 30 mM AceK (sweetener). The animal’s preference is tracked by electronic lick counters in each port. The upper insets show lick-rasters for glucose (red) versus AceK (blue) from the first and last 2000 licks of the behavioural test. Note that by 48 h the animals drink almost exclusively from the sugar bottle. b, Preference plots for sugar versus AceK (n = 9 mice, two-tailed paired t-test, p = 2.39 × 10⁻⁶), and MDG versus AceK (n = 5 mice, two-tailed paired t-test, p = 0.0024; Extended Data Fig. 1). Note that animals may begin the behavioural preference test exhibiting no preference for sugar (preference index ~0.5), some preference for sugar (preference index >0.5), or with an initial preference for the sweetener (preference index <0.5). However, in all cases they switched (or dramatically increased) their preference to sugar. c, Mice lacking the sweet taste receptor (T1R2/T1R3−/−)7, n = 5 mice, two-tailed paired t-test, p = 0.0038, and mice lacking TRPM5 (TRPM5−/−)15, n = 7 mice, two-tailed paired t-test, p = 0.0001, switched their preference to sugar even though they cannot taste it. d, Schematic of sugar stimulation for Fos induction. Strong Fos labelling is observed in neurons of the cNST (highlighted yellow). Scale bars, 100 μm. Similar results were obtained in multiple animals for each experiment (Extended Data Fig. 2). e, Quantitation of Fos-positive neurons. The equivalent area of the cNST (Bregma −7.5 mm) was processed and counted for the different stimuli.
The signal present in water alone was subtracted prior to plotting; ANOVA with Tukey’s HSD post hoc test against AceK (n = 6 mice): p = 4.68 × 10⁻⁵ (glucose, n = 8 mice), p = 0.001 (MDG, n = 5 mice). Values are mean ± s.e.m.