
Extended Data Figure 6: Vagal neuron responses to sugar and MDG are highly reproducible and timed-locked to the stimulus.
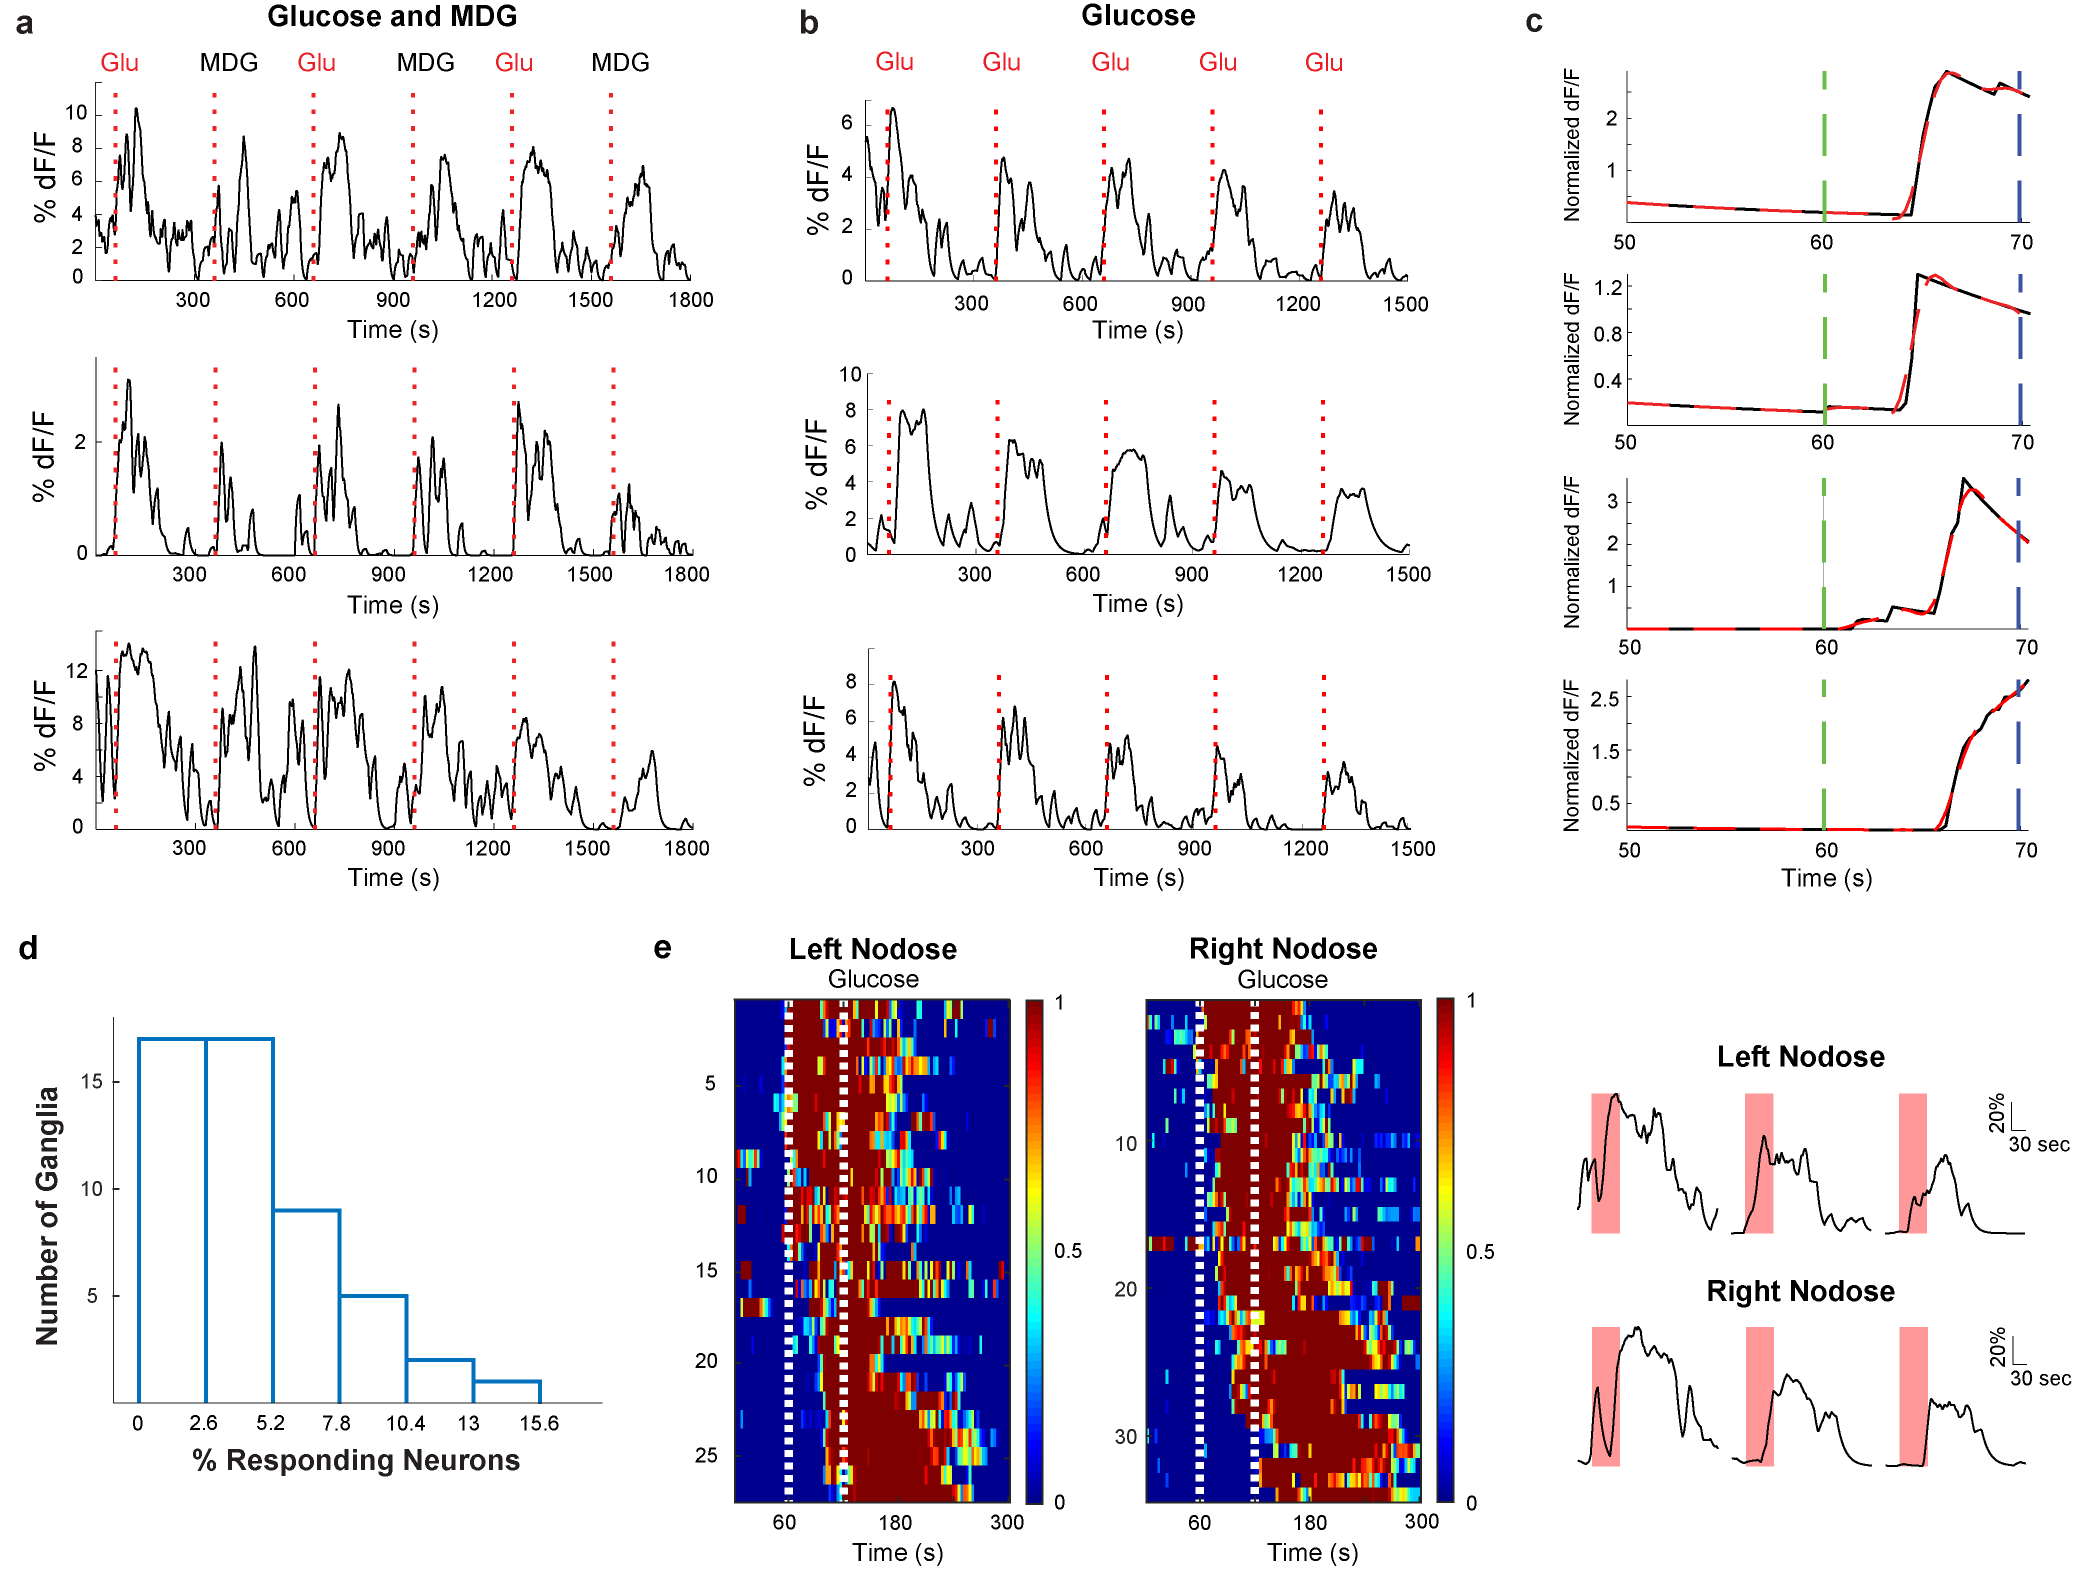
a, Shown are vagal neuron responses to 6 consecutive 10 s intestinal stimuli of alternating trials with 500 mM glucose and 500 mM MDG (stimulus delivery and timings are as described in Methods). Each of the sample traces depict the response from a different neuron. b, Shown are vagal neuron responses to 5 consecutive 10 s intestinal stimuli with 500 mM glucose (stimulus delivery and timings are as described in Methods). Each of the sample traces depict the response from a different neuron. c, Expanded time scale of responses to the 10 s 500 mM glucose stimulus from 10 s before to 10 s after termination of the stimulus. The green dash lines indicate the initiation of the stimulus, and the blue dash lines denote termination of the 10 s stimulus. Shown in solid black are the calcium responses, and shown in red are exponential fits to the response latency and kinetics. Note responses time-locked to stimulus delivery; top 2 traces depict 2 cells from 2 different mice in response to glucose, and bottom 2 traces depict 2 cells from 2 different mice in response to MDG; latencies varied between 3–6 s, and were within the 10 s stimulation window. Some cells exhibited longer latencies (see for example heat maps in Fig. 4 and Extended Data Fig. 8). We believe the cells with longer response “latencies” may represent intestinal glucose responders located farther down the intestinal segment, and thus would be expected to demonstrate longer latencies25. d, On the average, approximately 5% of vagal neurons respond reliably to a 10s 500 mM glucose stimulus. The histogram shows the percentage of GCaMP-expressing vagal neurons responding to the 10s glucose stimulus Average= 4.6 ± 0.05% (n= 4803 neurons from 51 ganglia, mean ± s.e.m.). e, Recent findings26 have suggested that appetitive behavioural responses are elicited through stimulation of vagal terminals originating from the right nodose ganglion. Shown are heat maps depicting z-score normalized average calcium responses of individual ganglion neurons after a 60 s pulse of 500 mM glucose. We observe no differences in responses to intestinal glucose from either the left or right vagal ganglia. Also shown are example traces from different neurons from the left and right Nodose ganglion; red bars indicate the 60 s stimulus; scale bars indicate % maximal response.