
Figure 5: Activation of sugar-responsive cNST neurons confers novel flavour preference.
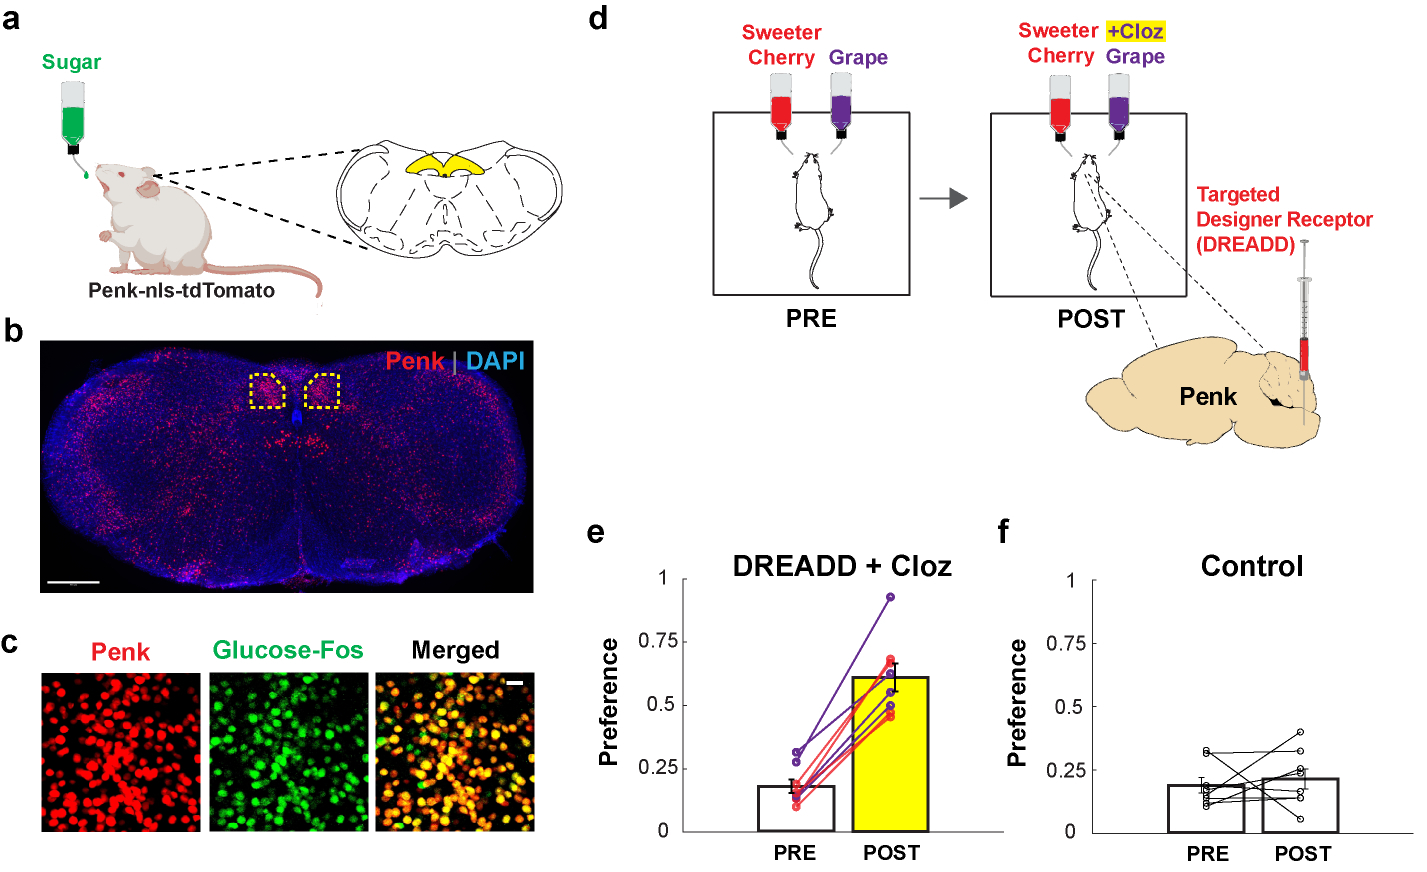
a-c, Penk-Cre mice were stimulated with 600 mM glucose, and brain slices were analysed for Fos and Penk labelling. Penk neurons were marked by expression of nuclear-localized tdTomato (Ai75D48). b, Low-magnification section of the brainstem (Bregma −7.5 mm) showing Penk expression (red); tissue was counterstained with DAPI (blue), n = 2 independent experiments. Scale bar, 500 μm; cNST, highlighted yellow. c, Sugar-preference neurons are Penk-expressing. Penk neurons labelled with tdTomato (from panel b) and glucose-activated neurons (Fos-labelled) marked green. Note the high degree of overlap in the merged image. Approximately 85% of sugar-activated cNST neurons are marked by Penk, and ~90% of cNST Penk neurons have sugar-Fos labelling (n = 3 mice). Scale bar, 20 μm. d, The activating DREADD receptor44,45 AAV-DIO-hM3Dq was targeted bilaterally to the cNST of Penk-Cre animals. Mice were then tested for their preference between two flavours for 48 h (PRE). The diagram shows an example using cherry (containing 2 mM AceK) versus grape (with 1 mM AceK). Animals were conditioned and tested using the un-preferred flavour plus the DREADD agonist Clozapine (POST; see Methods). e, Penk-hM3Dq animals initially prefer the sweeter solution. Remarkably, after associating Clozapine-mediated activation of Penk cNST neurons with the un-preferred flavour, all the Penk-hM3Dq mice significantly switched their preference (PRE = 18.1 ± 2.7 %, POST = 61.1 ± 5.5 %; n = 8 mice, two-sided Mann-Whitney U-Test, p = 1 × 10⁻⁴). The experiment was carried out using grape (purple lines) or cherry (red lines) as the initially un-preferred stimuli. f, Mice not expressing the DREADD receptor are unaffected by the presence of Clozapine (PRE = 19.0 ± 3.0 %, POST = 21.4 ± 4.0 %, n = 8 mice); control animals were subjected to the same conditioning and testing as the experimental cohort. Values are mean ± s.e.m.