
Extended Data Figure 2: Fos responses are robust and reliable.
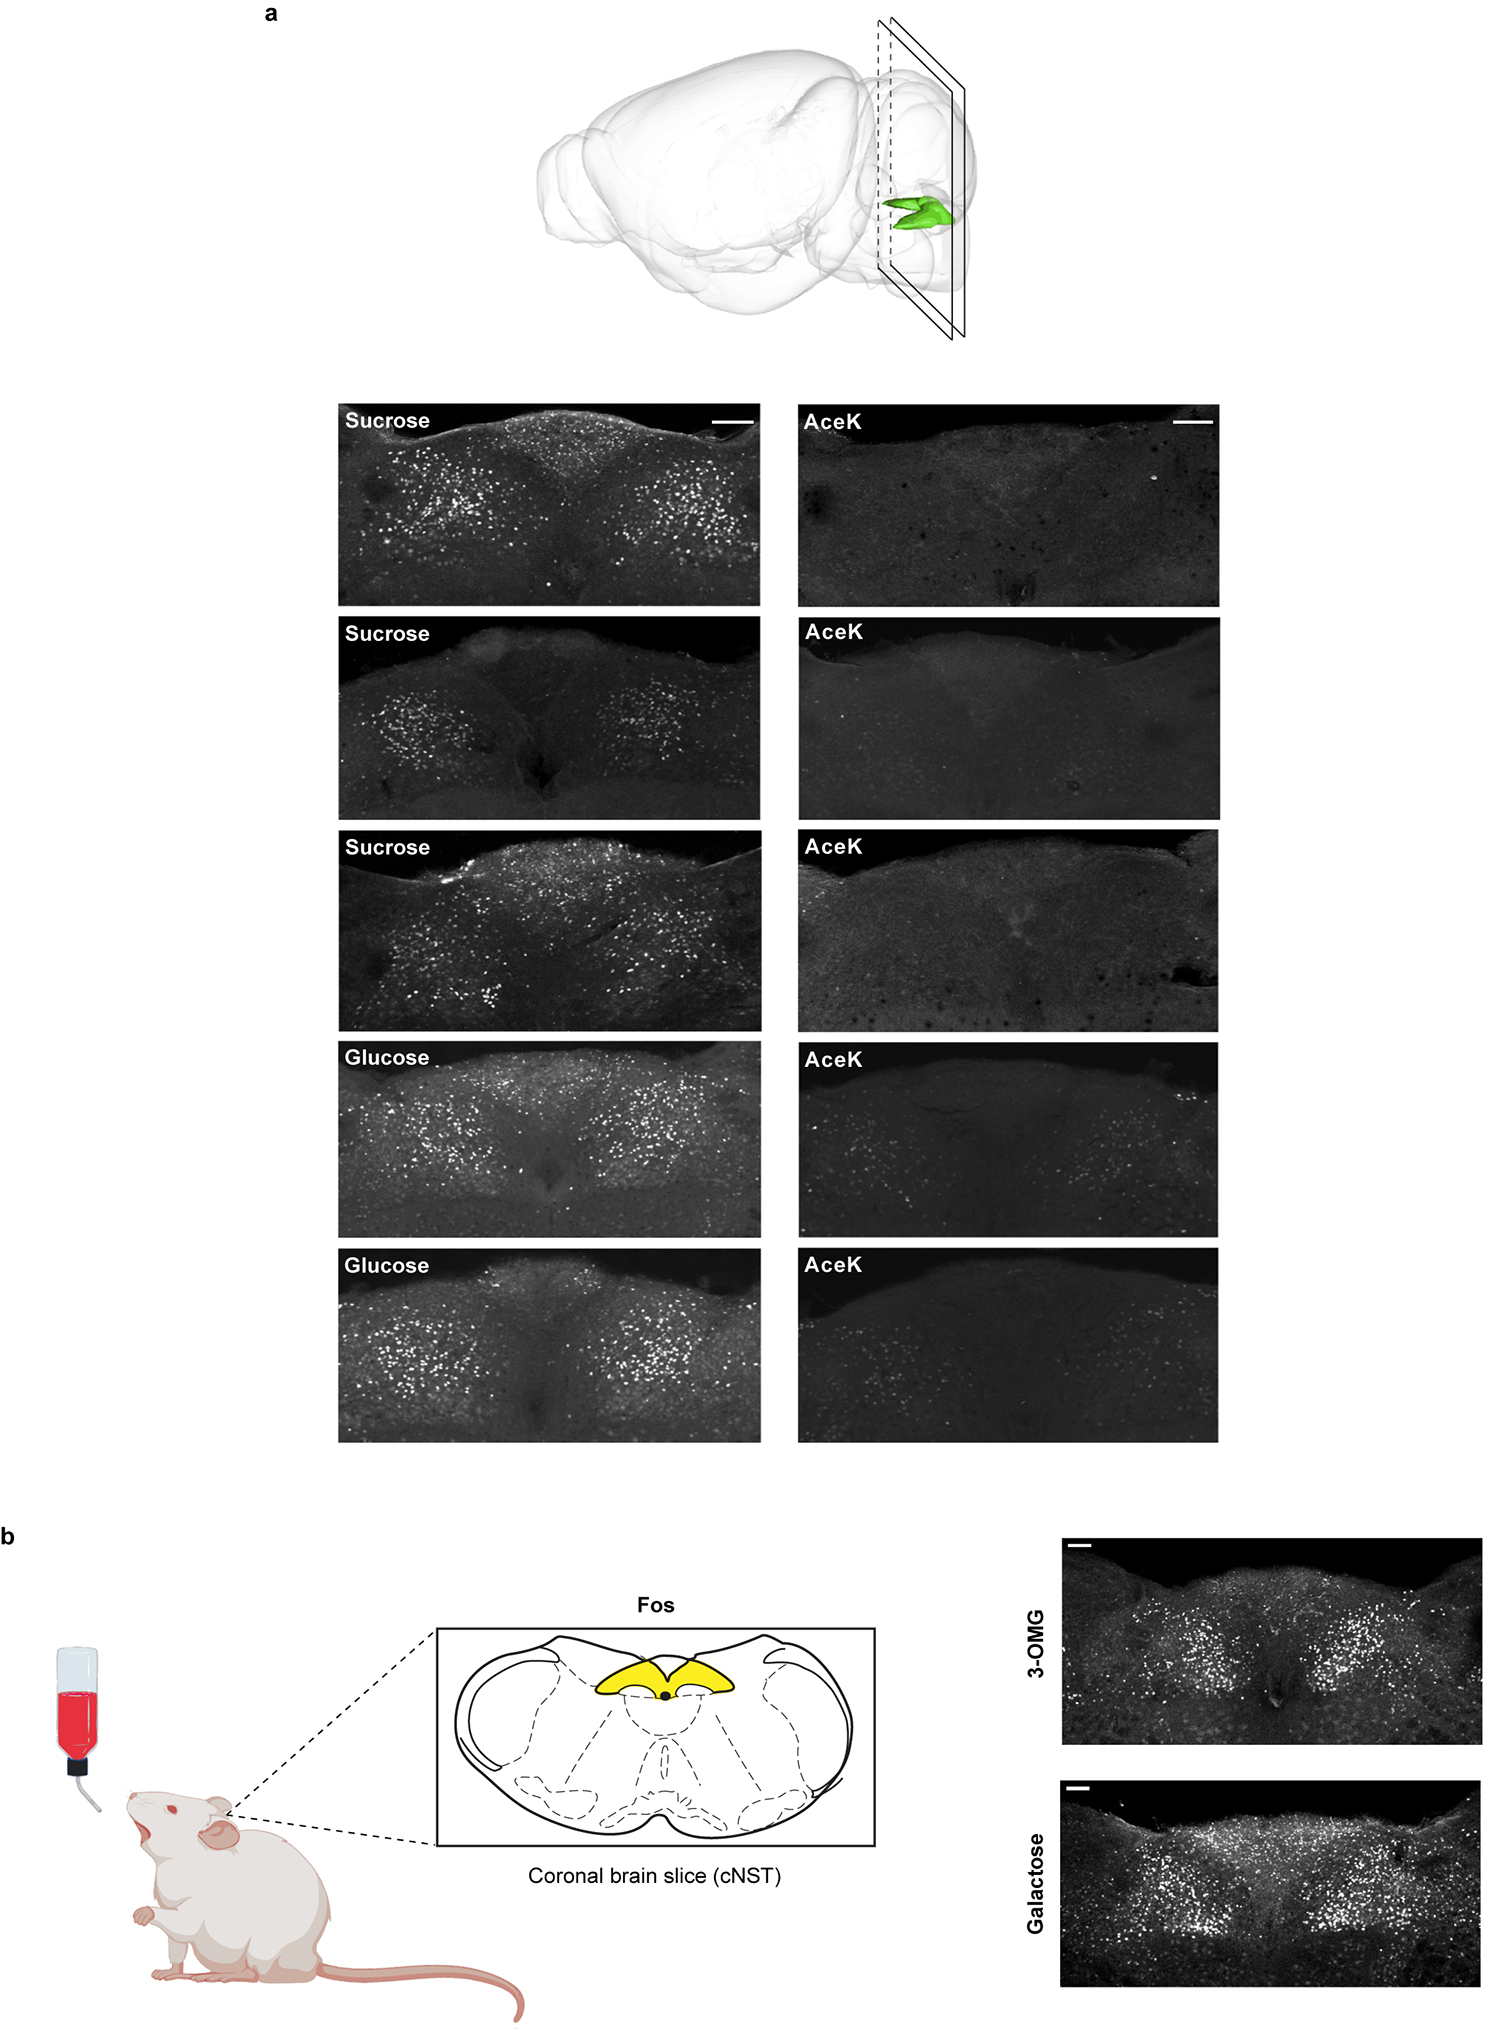
a, The brain diagram illustrates the position of the NST and the plane of the sectioning. Shown are cNST sections stained with Fos antibodies after exposing the animals to 90 min of 600 mM sucrose, 600 mM glucose or 30 mM AceK. Each panel is a confocal maximal projection image from Bregma −7.5 mm consisting of 3 sections 15 μm apart. Each panel (sucrose, glucose or AceK) represents a different animal, n = 3 independent experiments. Note the robustness of the signals across animals. See Methods for details. b, Mice were stimulated with 600 mM 3-O-Methyl-D-glucopyranose (3-OMG) (n = 6 animals) or 600 mM galactose (n = 3 animals) (see also Fig. 4 and Extended Data Fig. 10). Note strong Fos signals in cNST neurons, n = 2 independent experiments (total of 9 mice). Scale bars, 100 μm.