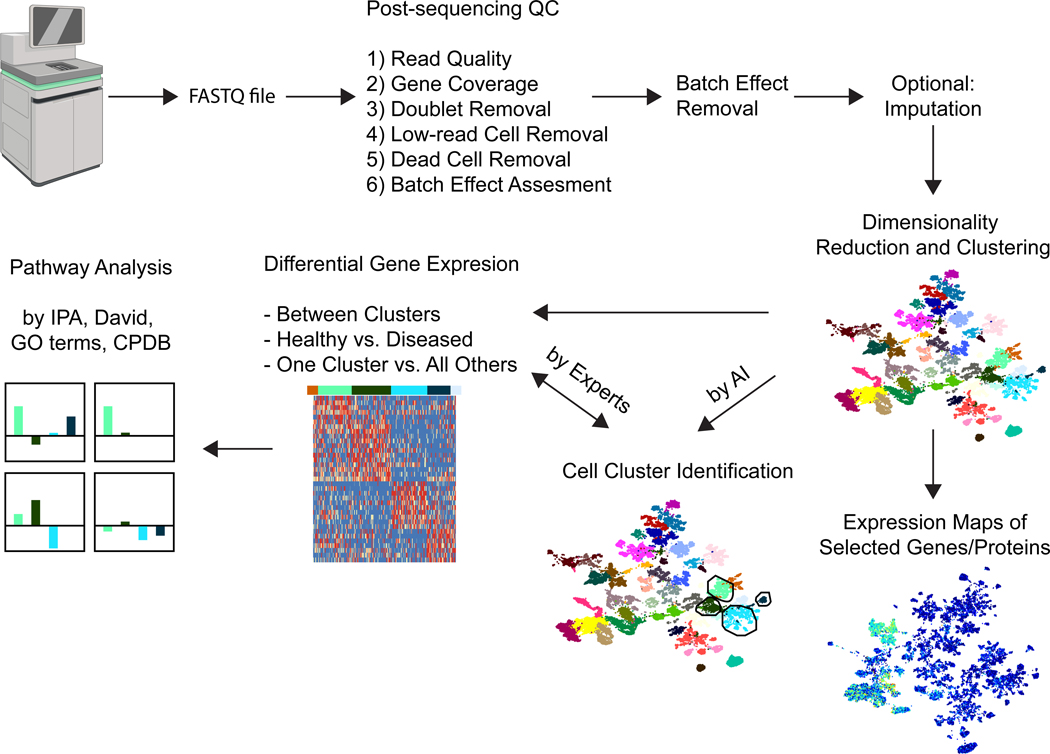
Figure 2.
Bioinformatic analysis workflow of CITE-seq and AB-seq experiments
The output of the sequencer is a FASTQ file with information about read quality. Further post-sequencing QC steps are indicated. If batch effects are detected, they can be removed if the experiment was designed to do so. Missing transcripts may be imputed. Dimensionality reduction (here by UMAP) and clustering (here by Louvain) result in 2 D maps of cells segregated by surface markers. Each antibody and transcript can be displayed as a heat map projected onto the UMAP. Differential gene expression is determined between clusters, or between samples from healthy and diseased individuals, or one cluster against all other cells. From the gene signature, pathway analysis is performed. The figure was created with BioRender.

