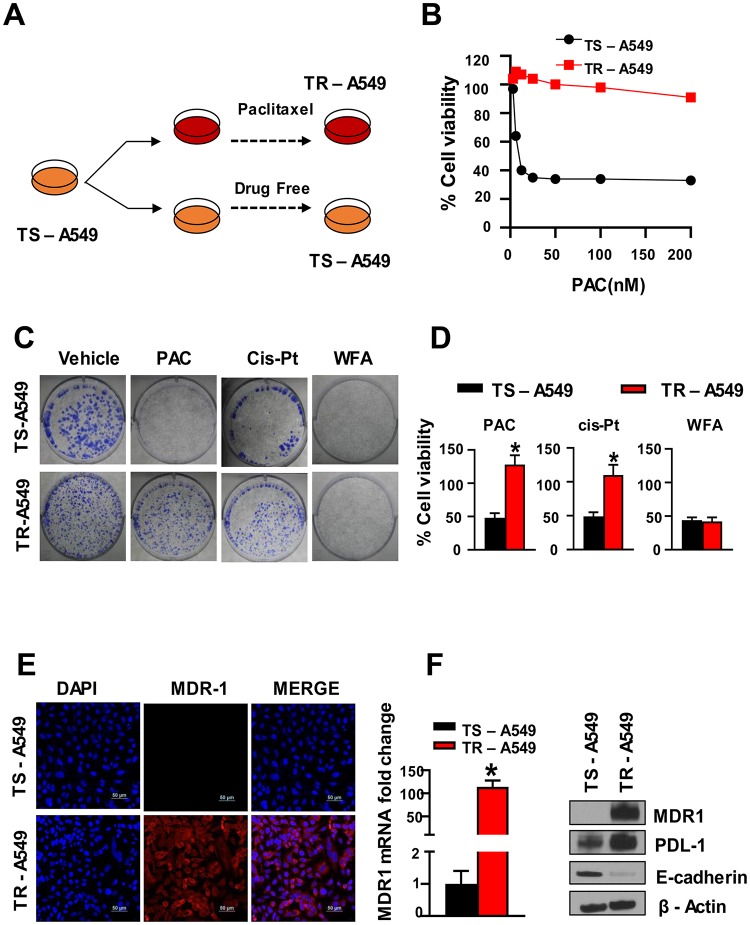
Figure 7. PAC chemoresistance in NSCLC cells.
(A) Schematic representation of PAC-induced chemoresistance in A549 cells, (B) The cells incubated with PAC became resistant to PAC (TR-A549) while those incubated in media without PAC remained sensitive to PAC (TS-A549). (C) Colony formation assay and (D) MTT assay, indicated decreased sensitivity of TR A549 cells to both PAC and CisPt but the cells remained sensitive to WFA. Student’s t test was used to compare the effect of treatment versus control. (E, F) Confocal imaging, (F) RT-PCR and Western blot analysis indicated a significant increase in the expression of multi-resistant drug-protein (MDR1).

