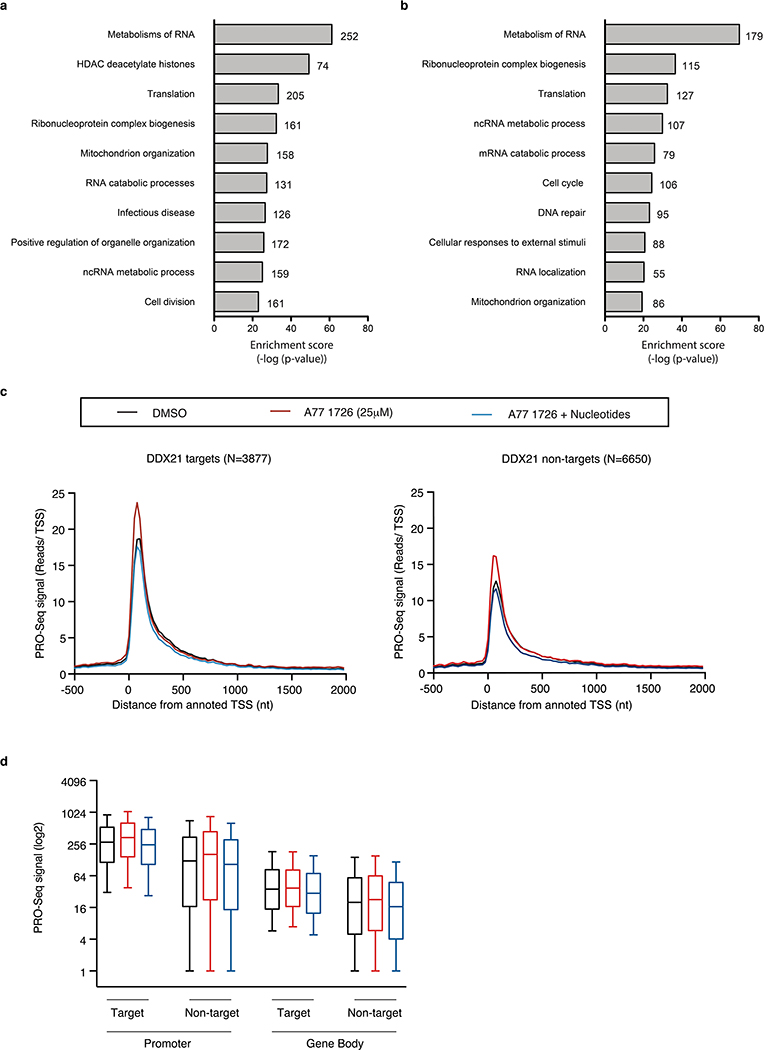
Extended Data Fig. 8. Gene Ontology analysis and PRO-Seq analysis in A375 cells.
Gene Ontology (GO) term enrichment analysis of genes down-regulated (a) and down-regulated DDX21 target genes (b) in A375 melanoma cells 48 hours post treatment with A77 1726 (n = 3 independent biological experiments, hypergeometric test and Benjamini-Hochberg correction). The number of genes associated to each GO term is shown at the end of each bar within the graph. (c) PRO-seq in A375 cells. Nascent transcription at the transcription start site (TSS) and at the gene body of DDX21 target and not-DDX21 target genes in cells treated for 24hrs with DMSO, A77 1726 or A77 1726 plus nucleotides (n = 3 biologically independent experiments). (d) Box plot of PRO-Seq signal shows no difference of nascent transcription in DDX21-bound and non-bound genes, as no changes are observed in promoter to gene body ratio between DDX21 targets and non-targets. Box plots represent median value and 25th and 75th percentiles. Whiskers are 10th and 90th percentile (n = 3 biologically independent experiments). Source data are available online.

