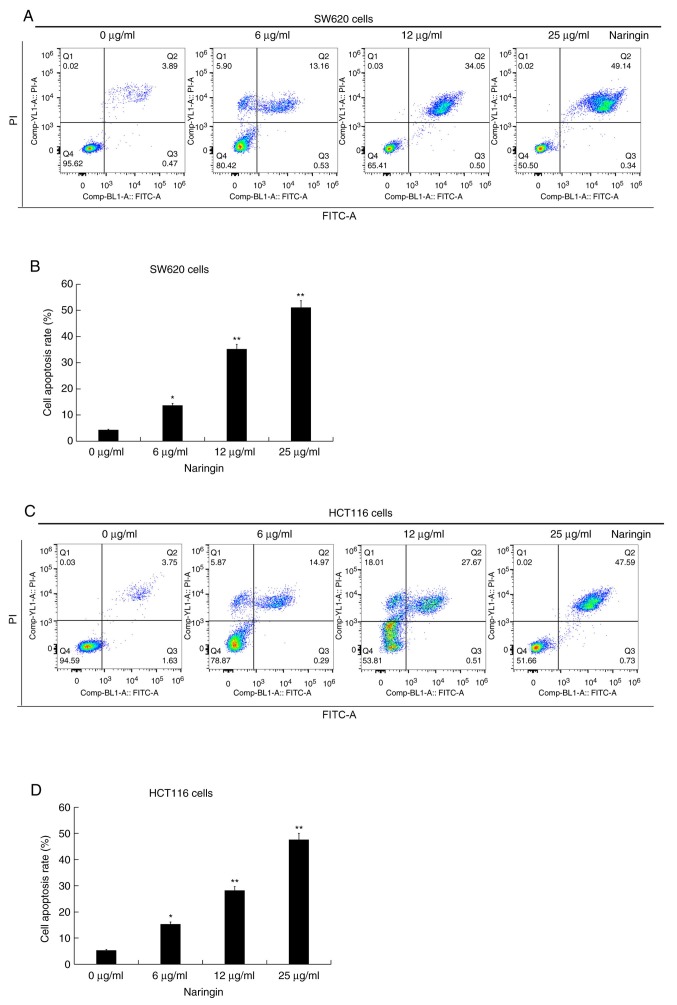
Figure 3.
Effect of naringin on colorectal cancer cell apoptosis. (A) Representative flow cytometry graphs of SW620 cells treated with different concentrations (6, 12 or 25 µg/ml) of naringin for 48 h at 37˚C and (B) the apoptosis rate was calculated following treatment. (C) Representative flow cytometry graphs of HCT116 cells treated with different concentrations (6, 12 or 25 µg/ml) of naringin for 48 h at 37˚C and (D) the apoptosis rate was calculated following treatment. Data are presented as the mean ± SD. *P<0.05 and **P<0.01 vs. 0 µg/ml naringin treatment group. PI, propidium iodide.

