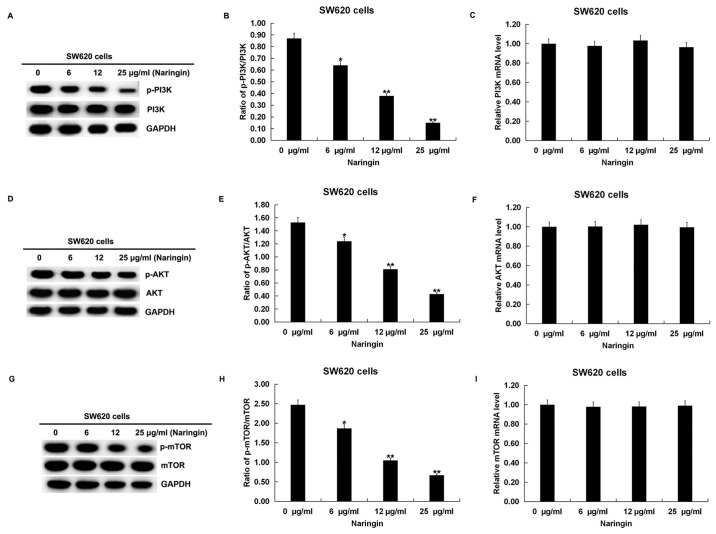
Figure 5.
Effect of naringin on the PI3K/AKT/mTOR pathway in SW620 cells. SW620 cells were treated with different concentrations (6, 12 or 25 µg/ml) of naringin for 48 h at 37˚C. (A) Protein expression levels of PI3K and p-PI3K were detected using western blotting and (B) the ratio of p-PI3K/PI3K was calculated. (C) mRNA expression levels of PI3K were detected using RT-qPCR. (D) Protein expression levels of AKT and p-AKT were detected using western blotting and (E) the ratio of p-AKT/AKT was calculated. (F) mRNA expression levels of AKT were detected using RT-qPCR. (G) Protein expression levels of p-mTOR and p-mTOR were detected using western blotting and (H) the ratio of p-mTOR/mTOR was calculated. (I) mRNA expression levels of mTOR were detected using RT-qPCR. Data are expressed as the mean ± SD. *P<0.05 and **P<0.01 vs. 0 µg/ml naringin treatment group. p, phosphorylated; RT-qPCR, reverse transcription-quantitative PCR.

