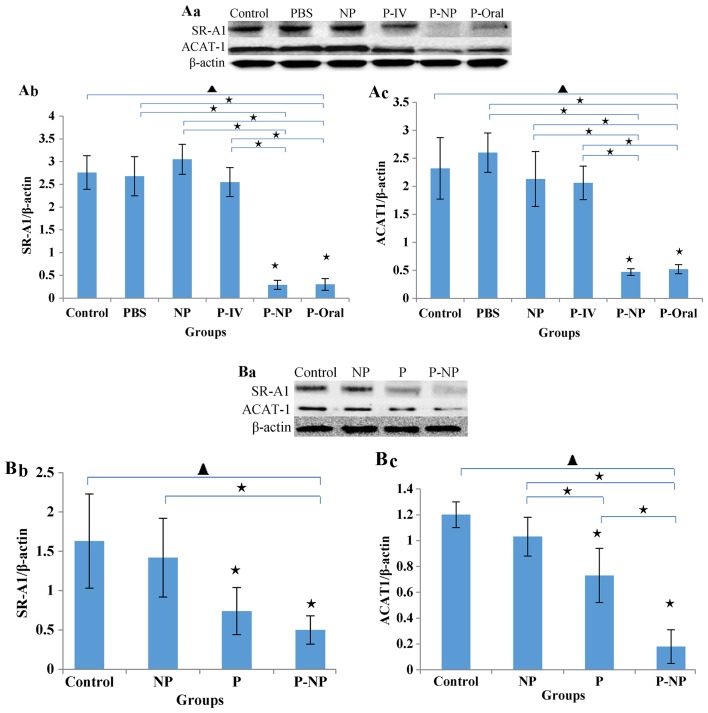
Figure 3.
Effects of P-NP on regulation of lipid metabolism. (A) Effects of P-NP on SR-A1 and ACAT-1 protein secretion in ApoE-knockout mice. (A-a) SR-A1 and ACAT-1 protein secretion in ApoE-knockout mice. (A-b) The SR-A1 level is presented as a percentage of the β-actin level (n=4). (A-c) The ACAT-1 level is presented as a percentage of the β-actin level (n=4). (B) Effects of P-NP on SR-A1 and ACAT-1 protein levels in THP-1-derived macrophages. (B-a) SR-A1 and ACAT-1 protein levels in THP-1-derived macrophages. (B-b) The SR-A1 level is presented as a percentage of the β-actin level (n=6). (B-c) The ACAT-1 level is presented as a percentage of the β-actin level (n=6). Before the first antibody staining, the three protein bands were excised according to their molecular weight. The protein bands were incubated with different antibodies and exposed to X-ray film; thus, although the blot images each of these figures were from the same membrane, there was variability among each set of images. ▲P<0.05 among all groups; «P<0.05 vs. control or as indicated. NP, nanoparticle; P-IV, pitavastatin intravenous; P-NP, pitavastatin nanoparticle; P-Oral, pitavastatin oral; SR-A1, scavenger receptor-A1; ACAT-1, cholesterol acyltransferase 1; ApoE, apolipoprotein E.

