Figure 1.
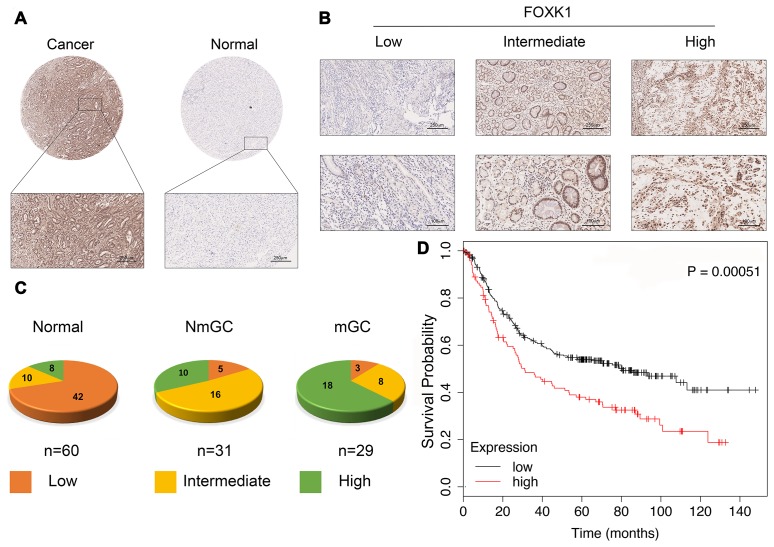
FOXK1 expression is significantly increased in GC metastasis. (A) Representative images of FOXK1 TMA analysis in GC tissues and adjacent tissues. Scale bar, 250 μm. (B) TMA assay of the levels of FOXK1 protein in GC tissues. Representative images of FOXK1 staining in GC tissues from the TMA are shown. Scale bar, 250 μm and 100 μm. (C) Analysis of staining in 60 groups of TMAs. (D) Kaplan-Meier analysis of survival rates of GC patients with high FOXK1 expression and GC patients with low FOXK1 expression.

