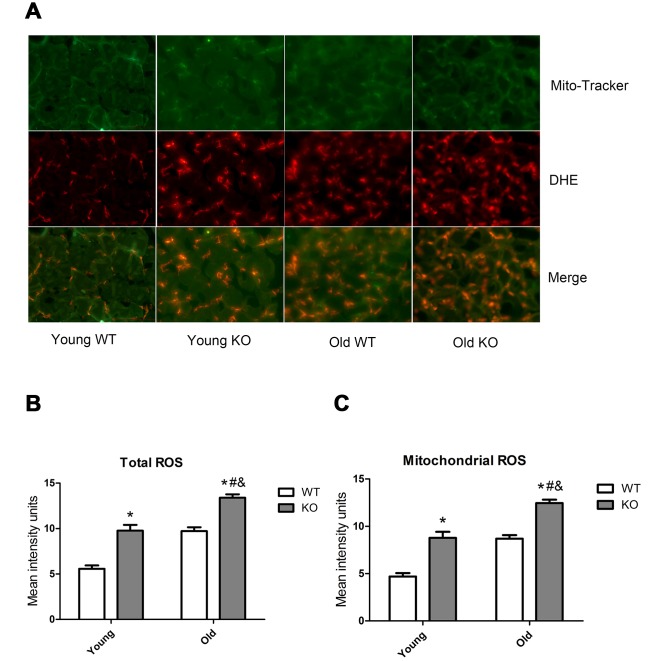
Figure 10.
ROS level in skeletal muscle of different groups. (A) Mito-Tracker green is a marker of mitochondria, dihydroethidium (DHE) is a probe of reactive oxygen species (ROS). Images from green and red fluorescence were merged (yellow) to locate the mitochondrial source of ROS generation. The yellow color indicates ROS within the mitochondria. (B) Total ROS. (C) Mitochondrial ROS. Data represent mean ± SE, n=3. #P <0.05 main effect of age by two-way ANOVA. &P <0.05 main effect of genotype by two-way ANOVA.*P <0.05 Nrf2 KO vs WT mice of the same age.

