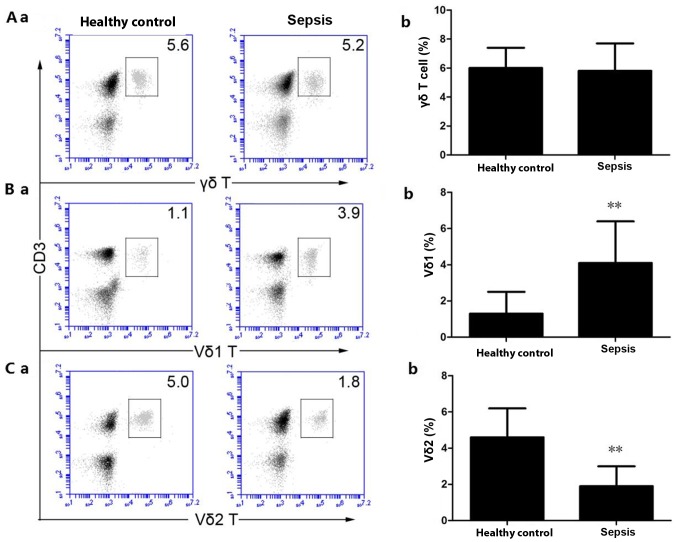
Figure 1.
Flow cytometric staining was used to detect the percentage of γδ T, γδ1 T and γδ2 T cells. (A-a) Detection of peripheral blood γδ T cells by flow cytometry. (A-b) Quantitative analysis of peripheral blood γδ T cells. (B-a) Detection of peripheral blood Vδ1 T cells by flow cytometry. (B-b) Quantitative analysis of peripheral blood Vδ1 T cells. (C-a) Detection of peripheral blood Vδ2 T cells by flow cytometry, (C-b) Quantitative analysis of peripheral blood Vδ2 T cells. **P<0.01 vs. the healthy control group.

