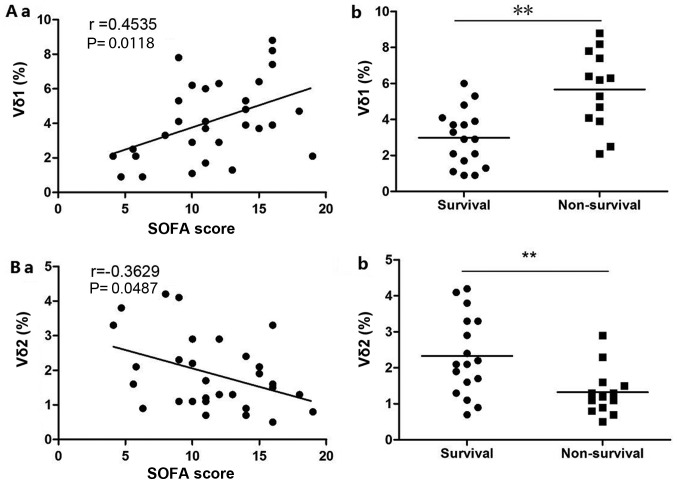
Figure 3.
Correlation between the ratio of Vδ1 T cells and Vδ2 T cells in the peripheral blood of septic patients and patient condition. (A-a) The higher the Vδ1 T cells ratio, the higher the SOFA score. (A-b) The higher the Vδ1 T cells ratio, the lower the patient survival rate. (B-a) The lower the Vδ2 T cells ratio, the higher the SOFA score. (B-b) The higher the Vδ1 T cells ratio the lower the patient survival rate. **P<0.01. SOFA, Sequential Organ Failure Assessment.

