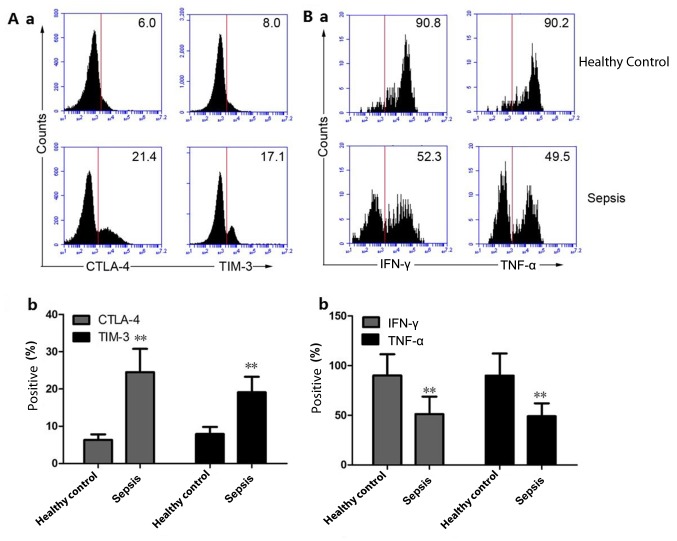
Figure 4.
Expression of immunosuppressive molecules on Vδ1 T cells and secretion of inflammatory cytokines by Vδ2 T cells. (A-a) The expression of CTLA-4 and TIM-3 on the surface of Vδ1 T cells was detected by flow cytometry. (A-b) Quantitative analysis of the expression of CTLA-4 and TIM-3 on the surface of Vδ1 T cells in healthy controls and sepsis patients. (B-a) The secretion of IFN-γ and TNF-α from Vδ2 T cells was detected by flow cytometry. (B-b) Quantitative analysis of the expression of IFN-γ and TNF-α from Vδ2 T cells in healthy controls and sepsis patients. The histograms are representative examples of the data (30 patients with sepsis and 30 healthy controls). **P<0.01 vs. the healthy control group. CTLA-4, cytotoxic T lymphocyte-associated antigen-4; TIM-3, T cell immunoglobulin and mucin domain 3; IFN-γ, interferon-γ; TNF-α, tumor necrosis factor-α.

