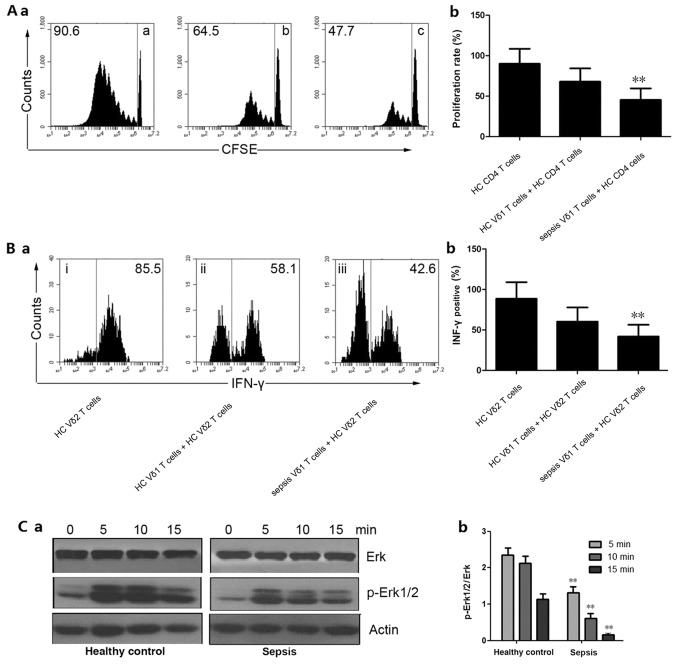
Figure 5.
Functional detection of Vδ1 and Vδ2 T cells. (A-a) Peripheral blood CD4 T proliferation was detected using CFSE staining by flow cytometry. (A-b) Quantitative analysis of proliferation rate. **P<0.01 vs. HC Vδ1 T cells + HC CD4 T cells. (B-a) IFN-γ secretion was detected by flow cytometry. (B-b) Quantitative analysis of IFN-γ-positive cells. **P<0.01 vs. HC Vδ1 T cells + HC CD4 T cells. (C-a) Western blotting was used to detect Erk and p-Erk1/2 expression. Actin was used as an internal reference protein. (C-b) Quantitative analysis of p-Erk1/2 expression. **P<0.01 vs. the respective HC group. IFN-γ, interferon-γ; p, phosphorylated; CFSE, carboxyfluorescein succinimidyl ester; HC, healthy control; a, HC CD4 T cells; b, HC Vδ1 T cells + HC CD4 T cells; c, sepsis Vδ1 T cells + HC CD4 cells; i, HC Vδ2 T cells; ii, HC Vδ1 T cells + HC Vδ2 T cells; iii, sepsis Vδ1 T cells + HC Vδ2 T cells.

