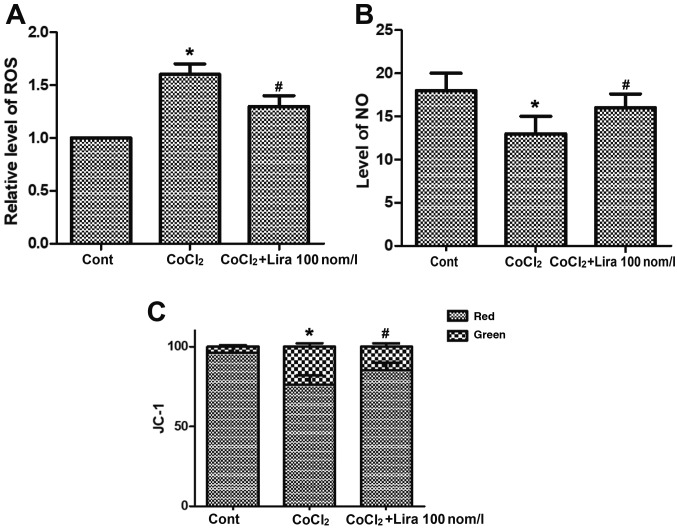
Figure 3.
Impact of liraglutide on oxidative stress in hypoxic cells. (A) ROS concentration detected in Cont group, CoCl2 group and CoCl2 + Lira group. (B) NO concentration detected in Cont group, CoCl2 group and CoCl2 + Lira group. (C) Change in mitochondrial membrane potential detected in Cont group, CoCl2 group and CoCl2 + Lira group. *P<0.05 vs. Cont groups; #P<0.05 vs. CoCl2 groups. ROS, reactive oxygen species; NO, nitric oxide.

