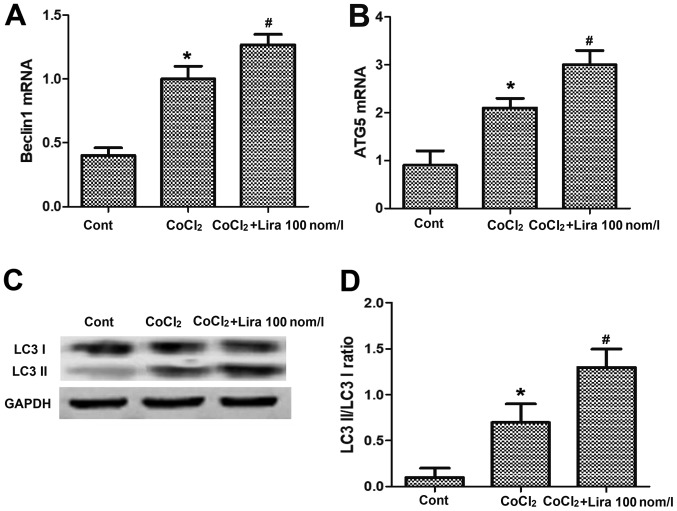
Figure 4.
Impact of liraglutide on autophagy of hypoxic cells. (A) mRNA expression of Beclin1 in Cont group, CoCl2 group and CoCl2 + Lira group detected via PCR. (B) mRNA expression in each group detected via PCR. (C) Protein expression of LC3 I, LC3 II and GAPDH in each group detected via WB. (D) Statistical analysis of LC3 II/LC3 I ratio. *P<0.05 vs. Cont groups; #P<0.05 vs. CoCl2 groups. WB, western blotting; Atg-5, autophagy-related-5.

