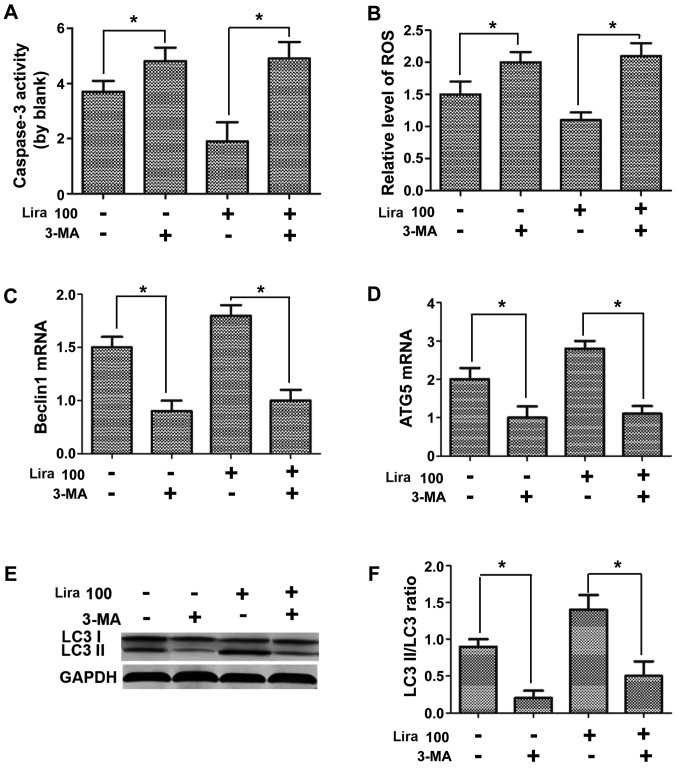
Figure 5.
Impacts of autophagy inhibitor on protective effects of liraglutide on hypoxic cells. (A) Caspase-3 activity detected in each group. (B) ROS activity detected in each group. (C) mRNA expression of Beclin1 detected in each group. (D) mRNA expression of Atg-5 detected in each group. (E) Protein expression of LC3 I, LC3 II and GAPDH in each group detected via WB. (F) Statistical analysis of LC3 II/LC3 I ratio. *P<0.05 between two groups. ROS, reactive oxygen species; WB, western blotting.

