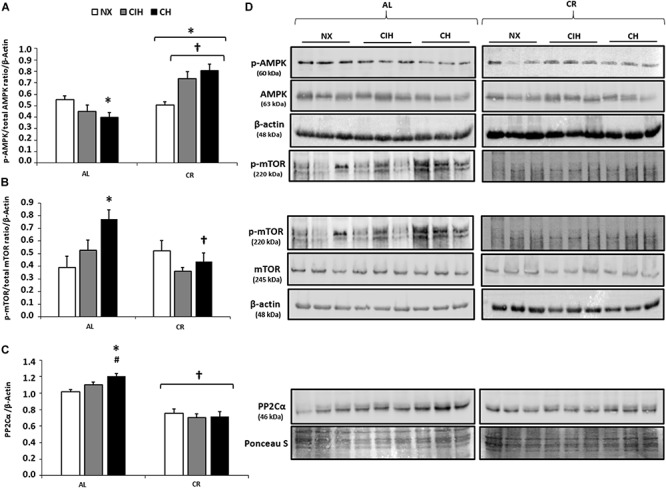
FIGURE 3.

Protein expression levels in the right ventricle (RV): Ad libitum (AL) and caloric restriction (CR) groups at day 30: normoxic group (NX), chronic intermittent hypoxia group (CIH), and chronic hypoxia group (CH). (A) Activation of AMPK (p-AMPK/total AMPK ratio); (B) Activation of mTOR (p-mTOR/total mTOR ratio) normalized by β-actin; (C) PP2Cα expression levels, normalized by Ponceau staining; and (D) Representative bands are shown. Values are means (X) ± standard errors (SEs). ∗p < 0.05: hypoxia-exposed vs. NX; #p < 0.05: CIH vs. CH. †p < 0.05: AL vs. CR.
