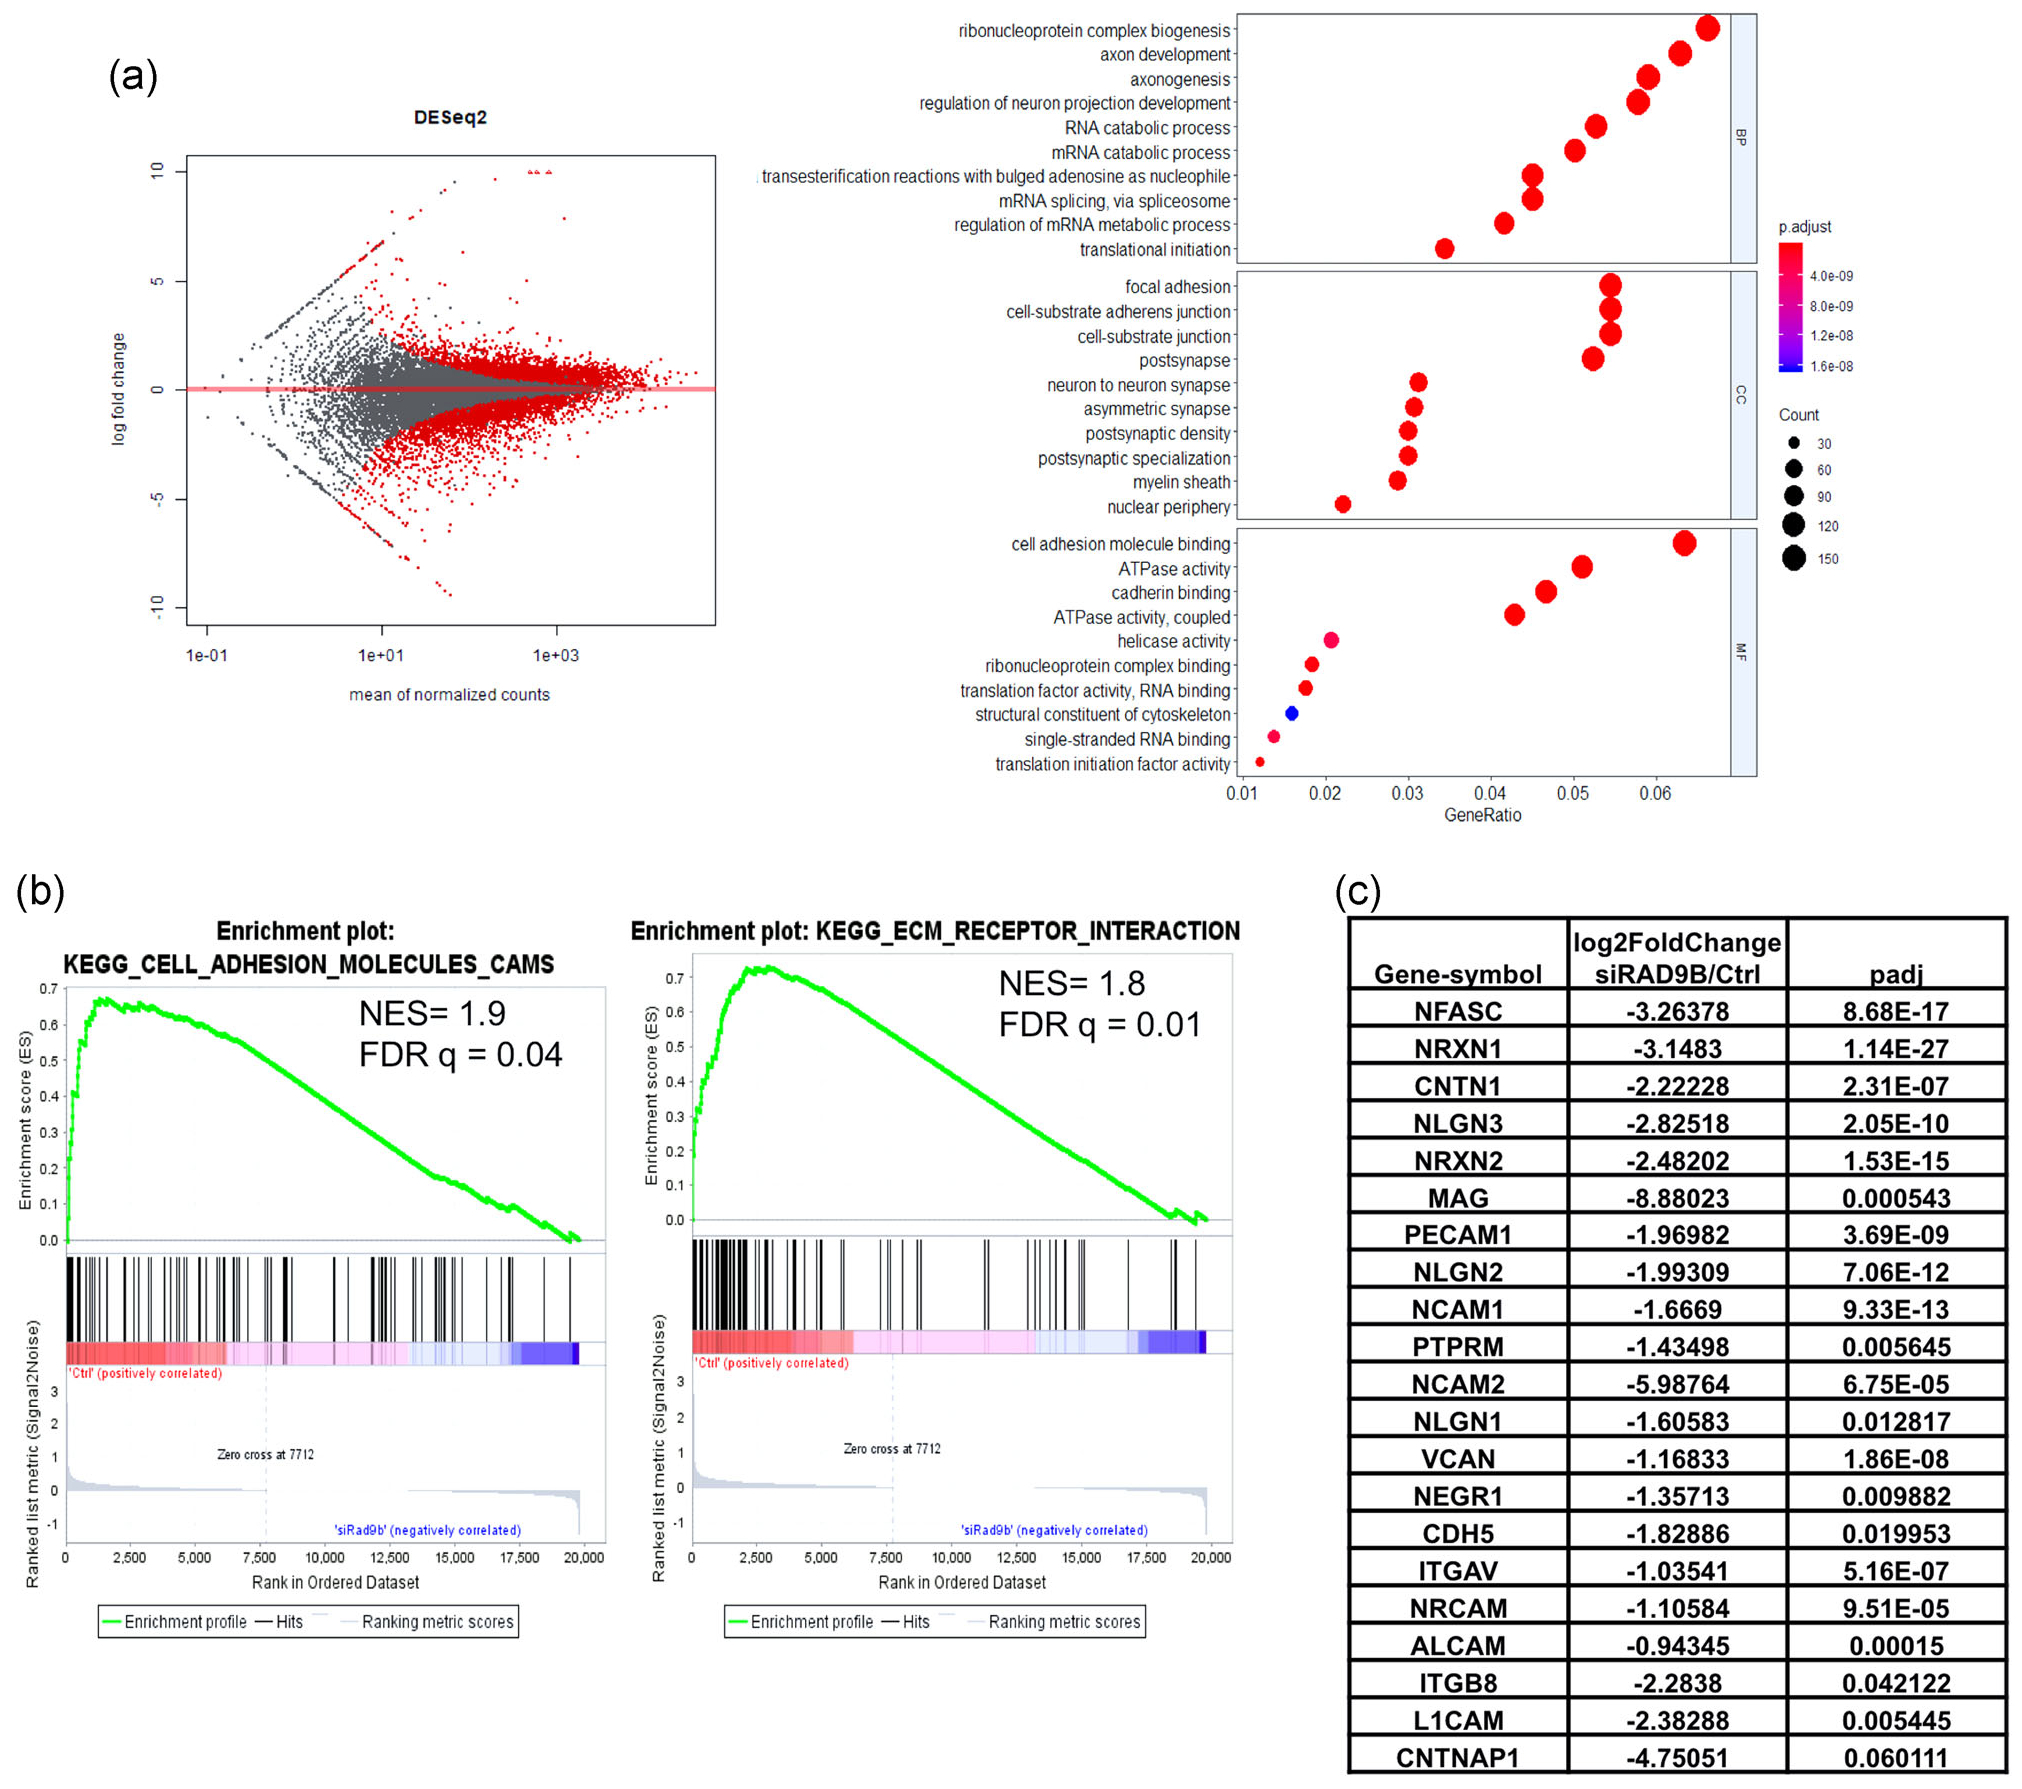
FIGURE 5.

RNA-seq data analysis on RAD9B-KD hESC cells. Total RNAs of hESC cells are collected on Day 11 after second transfection of siRNA (Scheme in Figure S3A), then applied to sequencing protocols. (a) MA-plot of total expression pattern. The right panel shows the dotplot for GO term enrichment analysis. (b) Gene set enrichment analysis for mostly enriched gene sets plotted by enrichment of gene expression in si-Control-treated cells compared with siRAD9B transfected cells. (c) Gene lists of “leading edge” genes in GESA analysis, with expression foldchange from the “KEGG_CELL_ADHESION_MOLECULES_CAMS” gene sets. GESA, gene set enrichment analysis; hESC, human embryonic stem cell; siRNA, small interfering RNA
