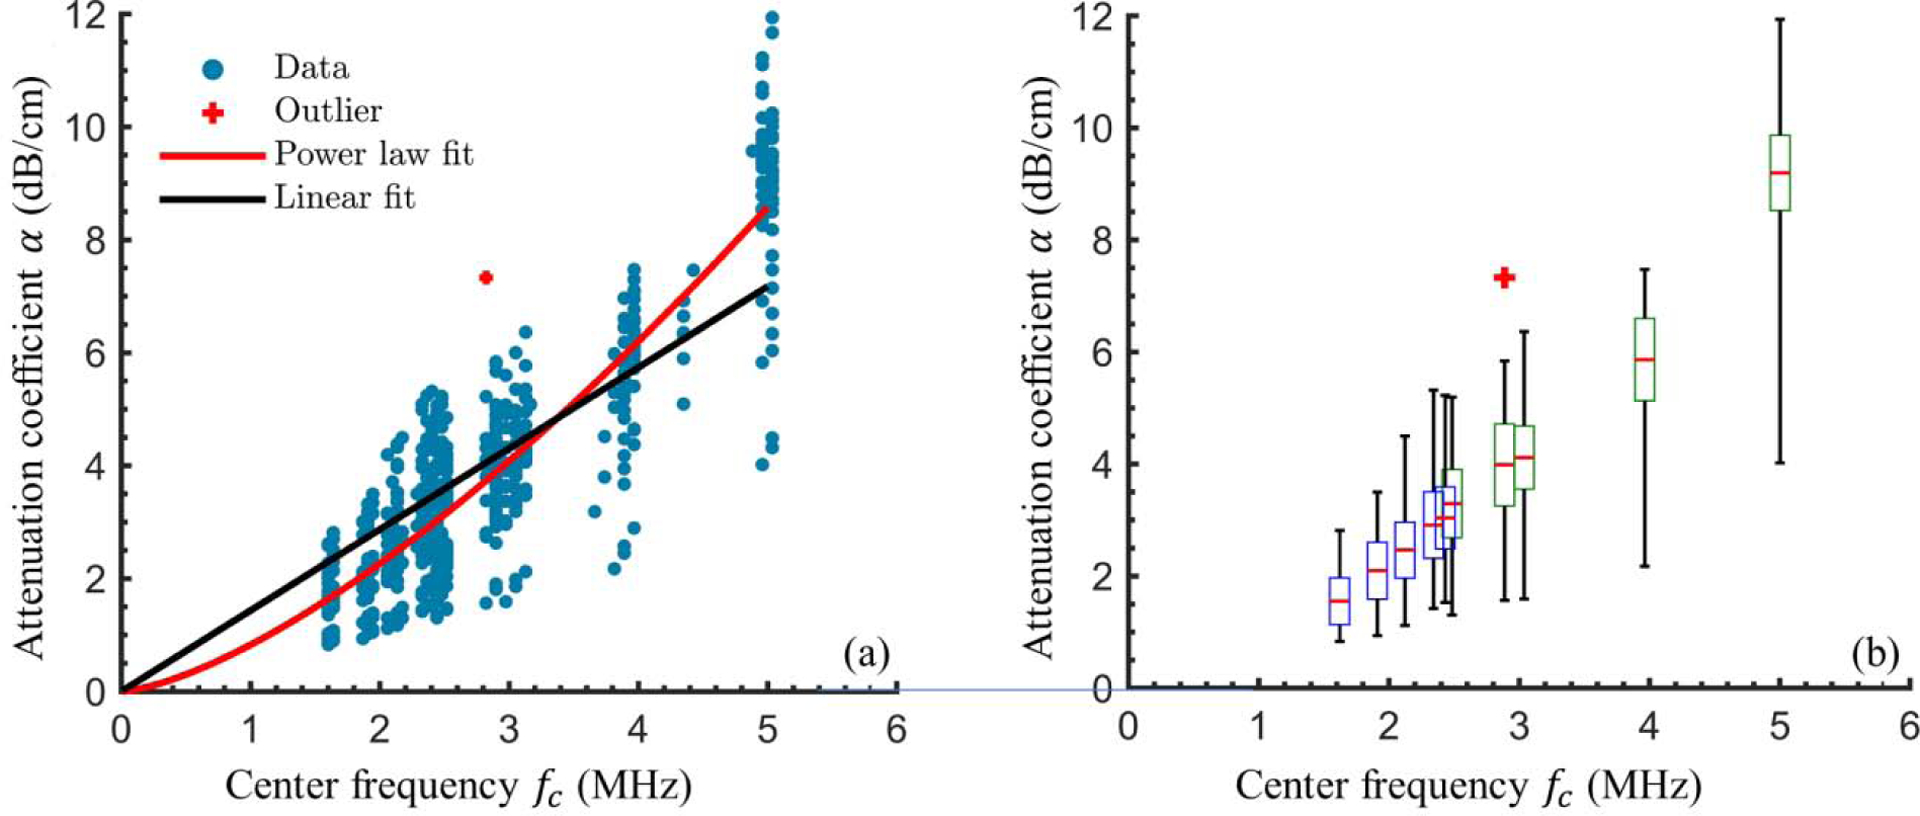
Figure 4:

Chest wall attenuation coefficients and best-fit curves. (a) Attenuation coefficient calculated from through-tissue and through-saline ultrasound measurements (blue circles) and best fit linear (black line) and power-law (red line) curves. (b)A box and whisker plot illustrates statistics relevant to the experimentally-determined chest wall attenuation coefficients at the mean reference center frequency for each ultrasound frequency setting. The median (red line), twenty-fifth and seventy-fifth percentiles (bottom and top box boundaries), and range (lines above and below each box) are indicated. The box color indicates the relevant probe (3S – blue, 5S – green). In both (a) and (b) the red plus-symbol indicates an outlier that was not used in the statistical analysis or curve fitting.
