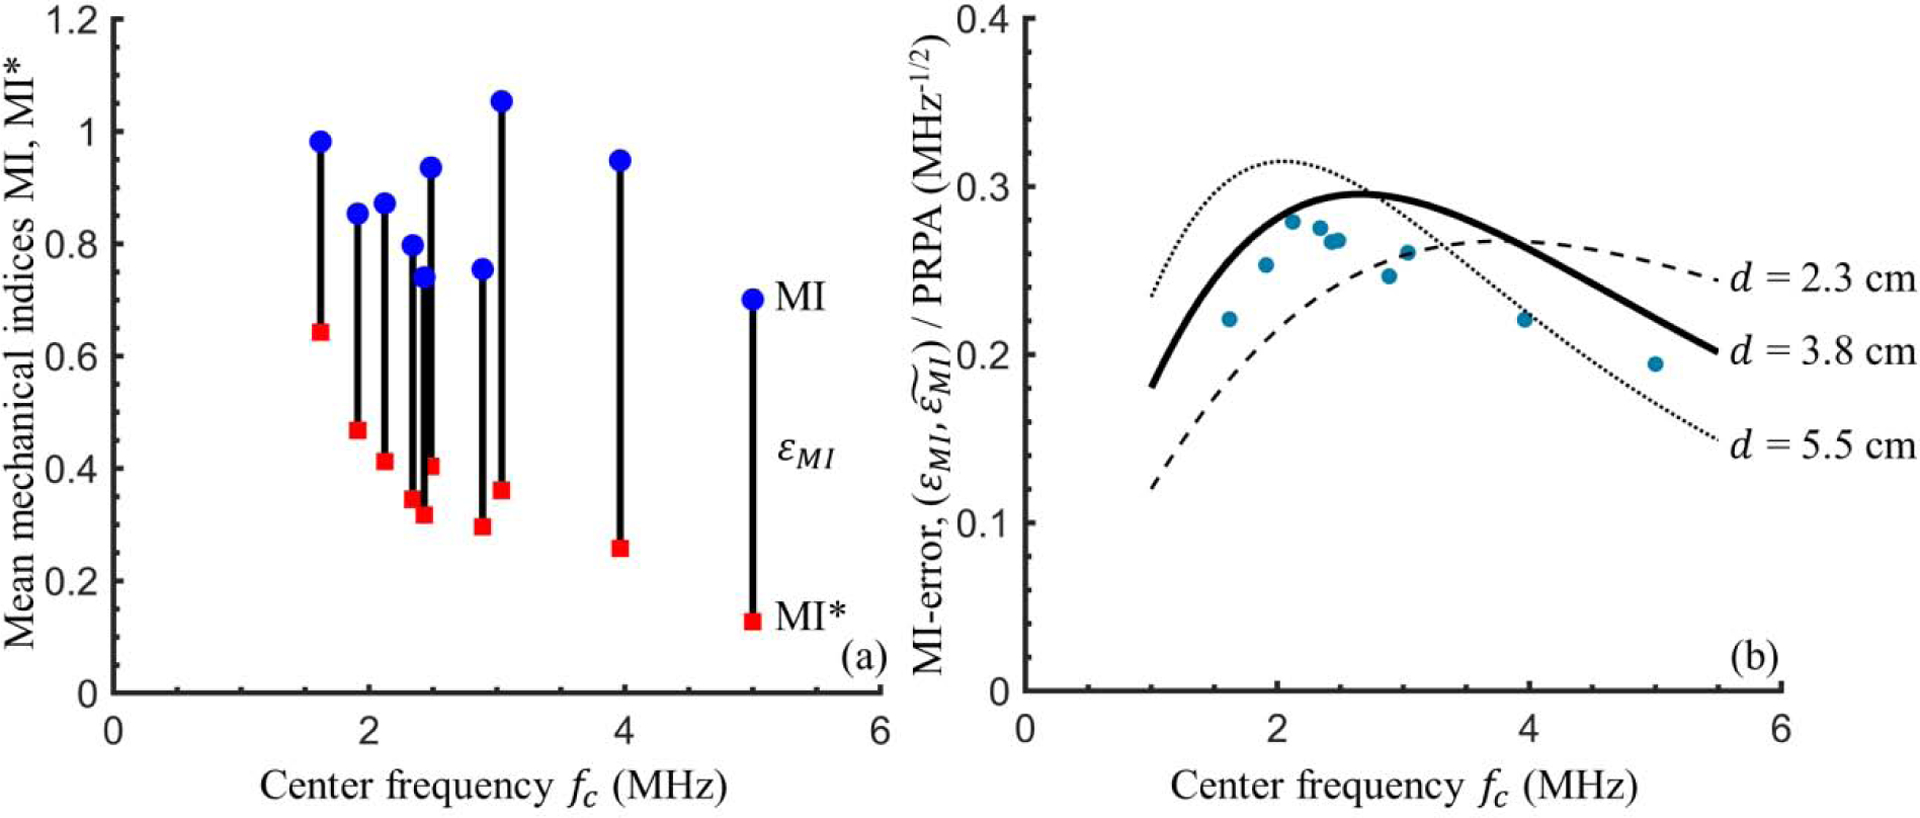
Figure 6:

Mechanical index errors calculations. (a) For the maximum power (0 dB) case at each frequency setting, the mean Mechanical Index MI (blue circular markers) and mean adjusted mechanical index MI* (red square markers) are calculated using the through-saline measured PRPA derated by 0.3 dB/cm/MHz and through-tissue measured PRPA, respectively. The black vertical lines of length εMI highlight the difference between the two. (b) The PRPA-scaled mechanical index error illustrated. Blue dots show the mean εMI/PRPA at each frequency setting. To illustrate the expected dependence of the mechanical index error on frequency and depth, black lines show . (see Equation 5) for tissue thicknesses of d = 2.3 cm (dashed), 3.8 cm (solid), and 5.5 cm (dotted), using the calculated best fit power law for attenuation, .
