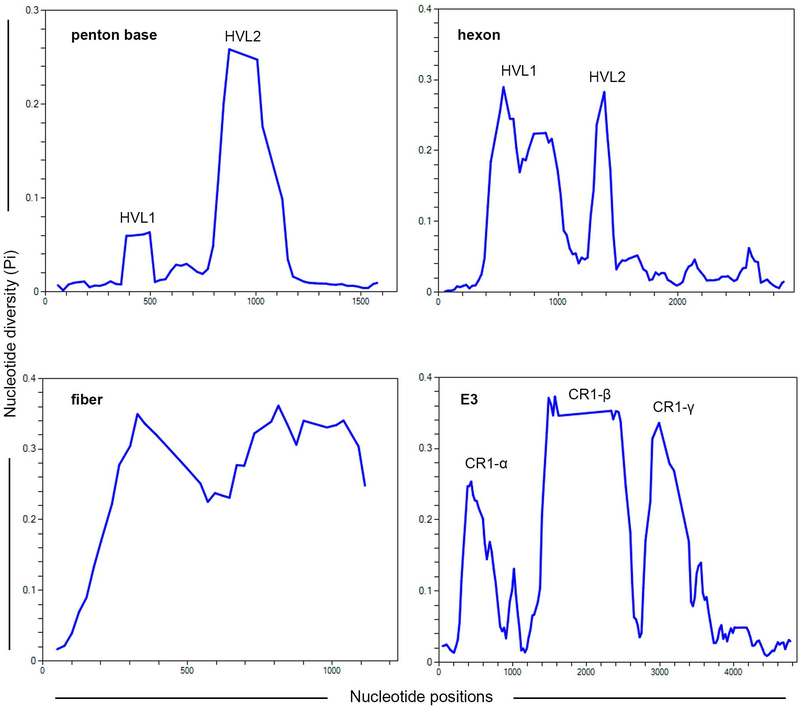
Fig. 3.
Nucleotide diversity Pi (π) plots showing the average number of nucleotide differences per site for the known hypervariable regions in HAdV-Ds, including penton base, hexon, fiber, and E3 CR1 genes, and performed with all 73 HAdV-D genotypes. The plot was constructed using DnaSP v6 with 100 nt window and 25 nt step size (gaps are excluded).

