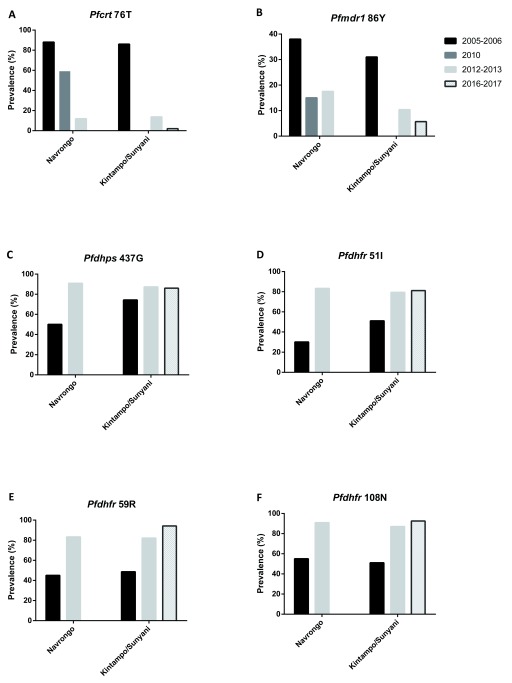
Figure 1. Trends in the prevalence of antimalarial drug resistant alleles from 2005 to 2017.
Summarized data from present study was compared to previous published data from Navrongo and Kintampo/Sunyani, Ghana, for pfmdr1 and pfcrt point mutations ( Duah et al., 2013) and for the antifolate resistance mutations ( Duah et al., 2012). No data was available for the pfcrt 76T and pfmdr1 86Y in 2010 in Kintampo/Sunyani ( Figure 1A–B). Also, no data was available for Navrongo in 2016–2017 in all the analysis. Deep black represents 2005–2006, light black represents 2010, plain grey represents 2012–2013 and crossed grey represents 2016–2017.

