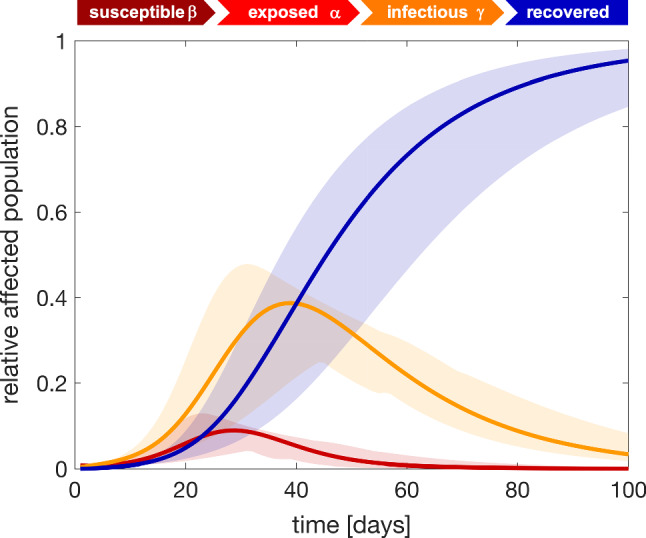
Fig. 11.

COVID-19 outbreak dynamics in the United States predicted with the SEIR model. Exposed, infectious, and recovered fractions of the affected populations for each state predicted using data from the early stages of the outbreak and assuming no additional countermeasures. Solid lines represent the mean and shaded regions highlight the 95% confidence interval. Latent period days, contact period days, infectious period days, and fraction of initial latent population
