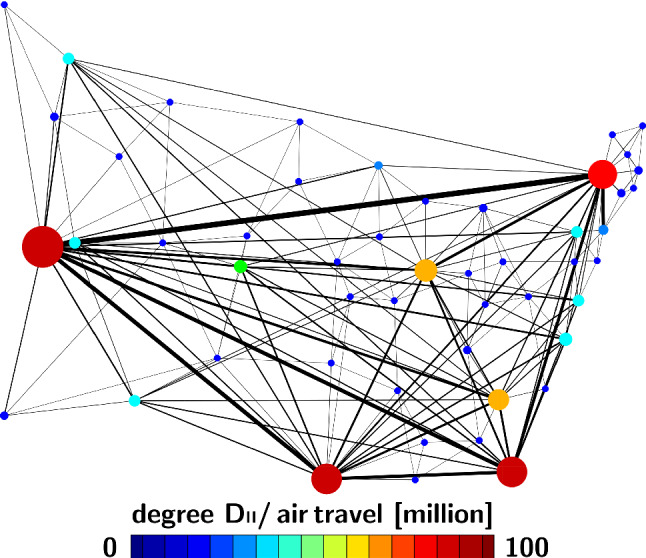
Fig. 2.

Network model of COVID-19 spreading across the United States. Discrete graph of the United States with nodes and the 200 most travelled edges. Size and color of the nodes represent the degree , thickness of the edges represents the adjacency estimated from annual incoming and outgoing passenger air travel
