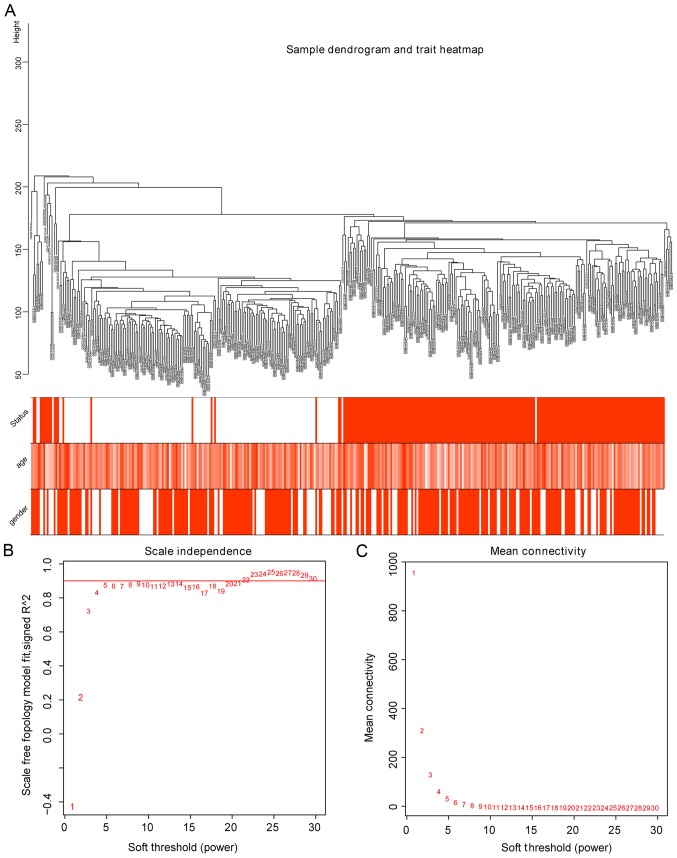
Figure 1.
Sample Clustering tree and soft threshold power analysis. (A) Sample dendrogram and trait heatmap were based on the GSE87211 dataset, which contained 163 CRC and 133 normal samples. The top 5,000 genes with the highest standard deviation values were used for WGCNA. Color intensity was proportional to disease status, sex and age. (B) Scale independence analysis of soft-thresholding power for the scale-free fit index of network topology. (C) Mean connectivity analysis for various soft-threshold powers. Determination of soft-thresholding power by analyzing network topology for thresholding powers from 1 to 30. WGCNA, weighted gene co-expression network analysis.

