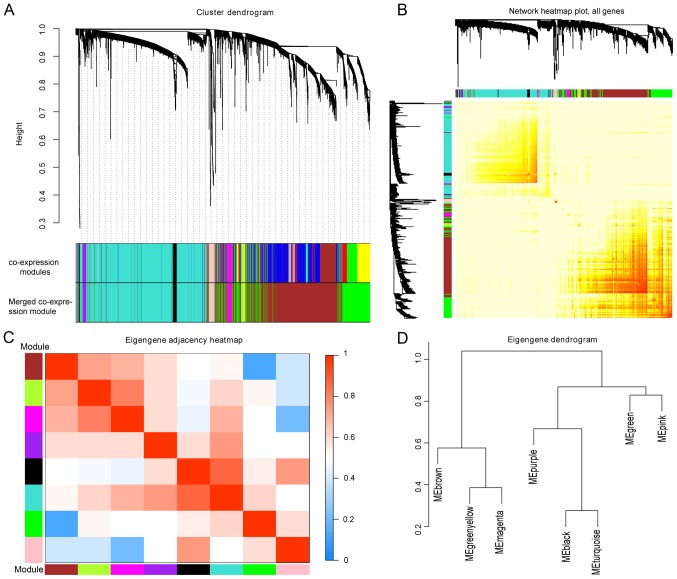
Figure 2.
Analysis of co-expressing genes modules. (A) Hierarchical clustering analysis. Each branch was assigned a different color, signifying that different genes belonged to different gene co-expression modules. A total of 9 merged co-expression modules were obtained by merging similar modules when the MEDissThres was set as 0.25. (B) Heatmap of interaction analysis of co-expressing genes. Different colors represent different degrees of overlap. (C) Heatmap plot showing the adjacency in the eigengene. (D) Dendrogram showing the association among 8 co-expression modules.

