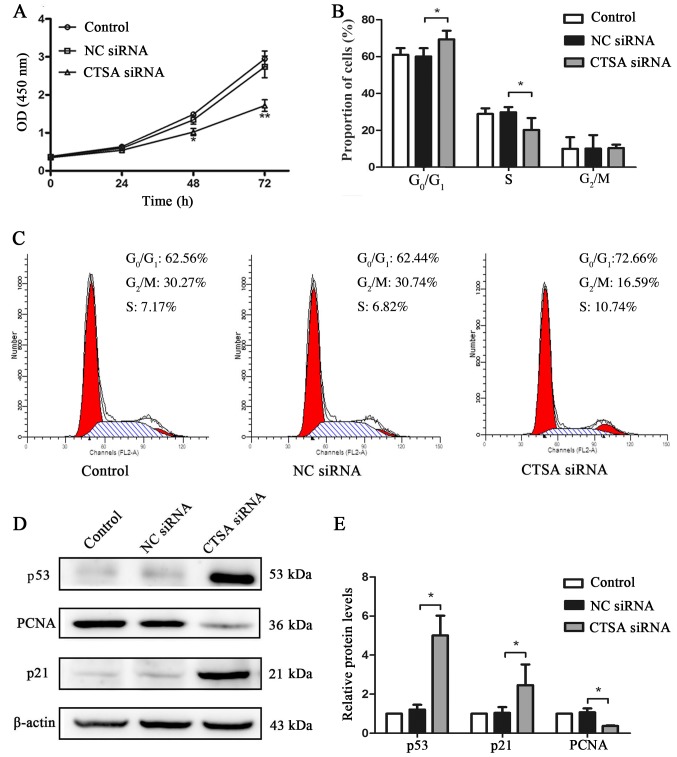
Figure 3.
Effects of CTSA knockdown on the proliferation, cell cycle and protein expression of A549 cells. (A) Proliferation of A549 cells transfected with CTSA siRNA and NC siRNA was measured using the Cell Counting Kit-8 assay. **P<0.01 vs. the NC siRNA group. (B) The proportion of transfected A549 cells in each stage of the cell cycle was detected by flow cytometry. *P<0.05, as indicated. (C) Representative plots of the flow cytometry analysis of cell cycle distribution in transfected A549 cells. Protein expression levels of p21, p53 and PCNA in transfected A549 cells were (D) determined by western blotting and (E) quantified. *P<0.05. CTSA, cathepsin A; siRNA, small interfering RNA; NC, negative control; OD, optical density; PCNA, proliferating cell nuclear antigen.

