
Figure 5.
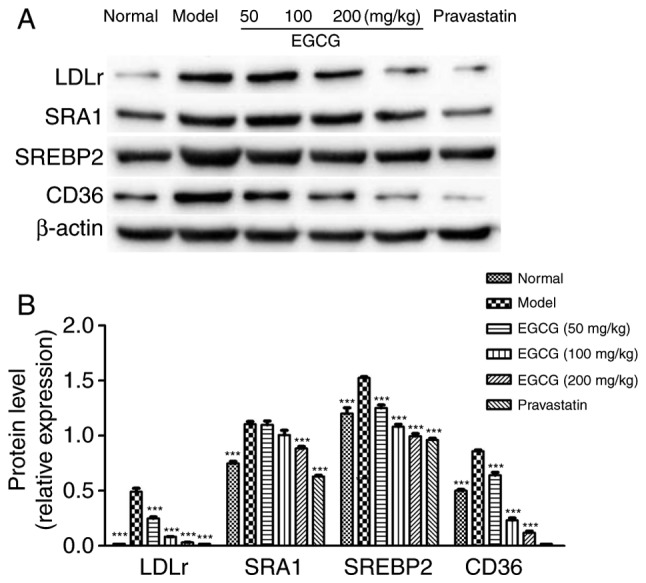
Protein levels of SRA1, CD36, SREBP2 and LDL-r. (A) Western blot analysis of SRA1, CD36, SREBP2 and LDL-r. (B) Quantification of the target protein level. Comparisons were assessed with one-way ANOVA followed by Tukey's post hoc test. **P<0.01, ***P<0.001 vs. model group. SRA1, scavenger receptor A; CD, cluster of differentiation; SREBP2, sterol regulatory element binding protein 2; LDL-r, low-density lipoprotein receptor.