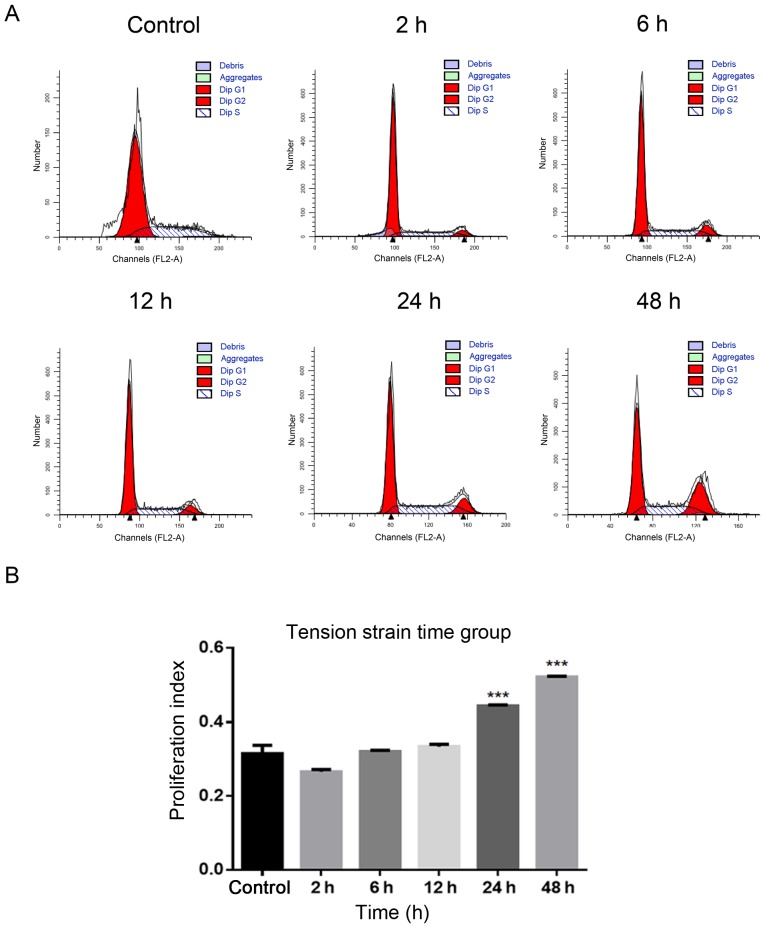
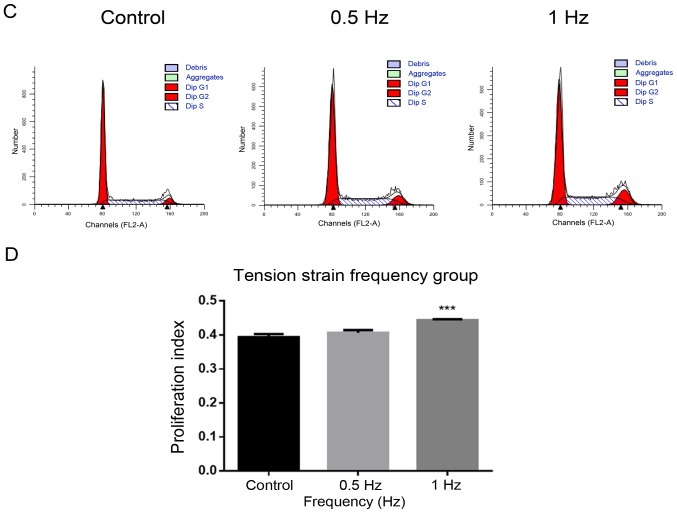
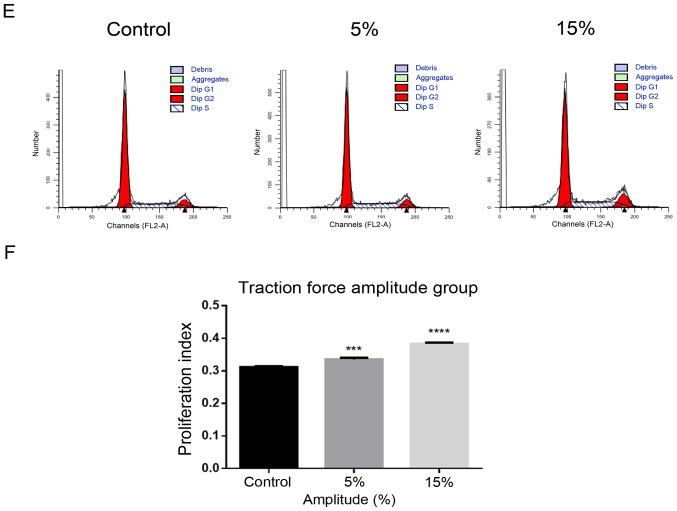
Figure 2.
Determination of the most suitable strain condition using flow cytometry. (A) Time group: (B) Compared with the control group without tension, the PI increased significantly in 24 h and 48 h groups. (C) Frequency group: (D) Compared with the control group without tension, the PI increased significantly in 1 Hz group. Determination of the most suitable strain condition using flow cytometry. (E) Amplitude group: (F) Compared with the control group without tension, the PI increased significantly in the 5 and 15% groups. All the control groups were non-tension loaded groups. The data of PI are shown as the mean ± SD from three wells/group. ***P<0.001, ****P<0.0001 vs. control. PI, proliferation index.


