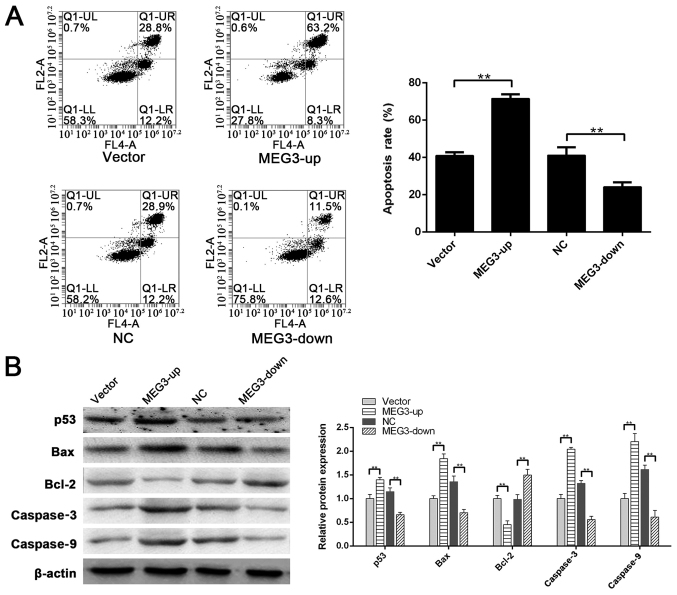
Figure 3.
Role of MEG3 in H2O2-induced apoptosis. (A) Apoptotic rates of the vector group, MEG3-up group, NC group and MEG3-down group were 40.93±1.82, 71.53±2.31, 41.13±4.35 and 24.09±2.54%, respectively. Apoptotic rate in the MEG3-up group was significantly greater than that in the vector group. Apoptotic rate in the MEG3-down group was significantly lower than that in the NC group. (B) Compared with the vector group, the expression of p53, Bax, caspase3 and caspase9 was significantly higher in the MEG3-up group. Compared with the NC group, the expression of p53, Bax, caspase3 and caspase9 was significantly lower in the MEG3-down group. Compared with the vector group, Bcl-2 was downregulated in the MEG3-up group. Compared with the NC group, Bcl-2 was upregulated in the MEG3-down group. **P<0.01. MEG3, maternally expressed gene 3; NC, negative control.

