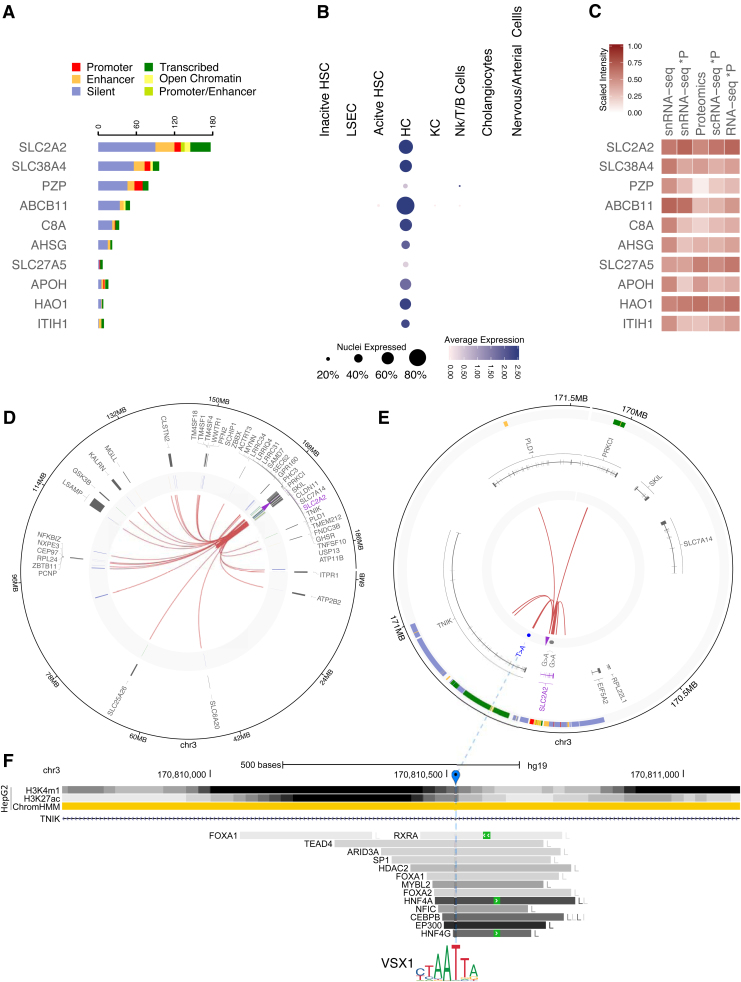
FIG. 4.
Overview of top 10 HCC genes with the largest number of significant probe-probe or probe-distal interactions detected in both proteomics and snRNA-seq. (A) Number of probe-distal (right panel) HiCap interactions associated to liver-specific chromHMM annotations. (B) Expression levels from snRNA-seq in different liver cell types. The size of the dot represents the number of nuclei that expresses the gene, while the color intensity the overall level of expression. (C) Heatmap comparing the expected and experimental levels of protein abundance from RNA-seq and MS proteomics experiments, respectively. The first column shows the log2-average expression of genes from the in silico bulk snRNA-seq, while the second one illustrates the estimated protein abundance calculated after calibrating the in silico bulk snRNA-seq levels for RTP abundancy estimation factors. The third column shows the experimental level of the protein abundance detected by MS. The last two columns show the estimated protein abundance calculated after calibrating the log2-average in silico bulk scRNA-seq levels and the log2-average number of reads of bulk RNA-seq. (D, E) Circos plots illustrating interactions of the probe for SLC2A2 with distal elements harboring active enhancer elements. (D) The first track shows gene annotations overlapping probe-distal interactions. The second track shows manually curated chromHMM annotations overlapping interacting regions, while the inner one shows the experimental HiCap interactions. The purple arrow marks the probe location. (E) A zoom-in on the area of interest for the circos plot in (D). The first two tracks show chromHMM and gene annotations, respectively. The third track shows HCC-specific mutations detected from the PanCancer consortium. The inner track shows 16 the probe-distal HiCap interactions overlapping active enhancer elements. The purple arrow marks the probe location. (F) The genomic landscape of the T > A motif-breaking mutation identified in (E) (marked in blue) located in one of the introns of the TNIK gene. The UCSC genome browser tracks represent from the top: (1) the ChIP-seq signals for two active enhancer-specific histone modifications and ChromHMM annotations in HepG2 and (2) the transcription factors binding from ChIP-seq experiments from the ENCODE project with the coloring (light gray to dark gray) proportional to the signal strength observed in different cell lines (cell abbreviations can be found at: https://tinyurl.com/watv2v7). HCC, hepatocellular carcinoma.

