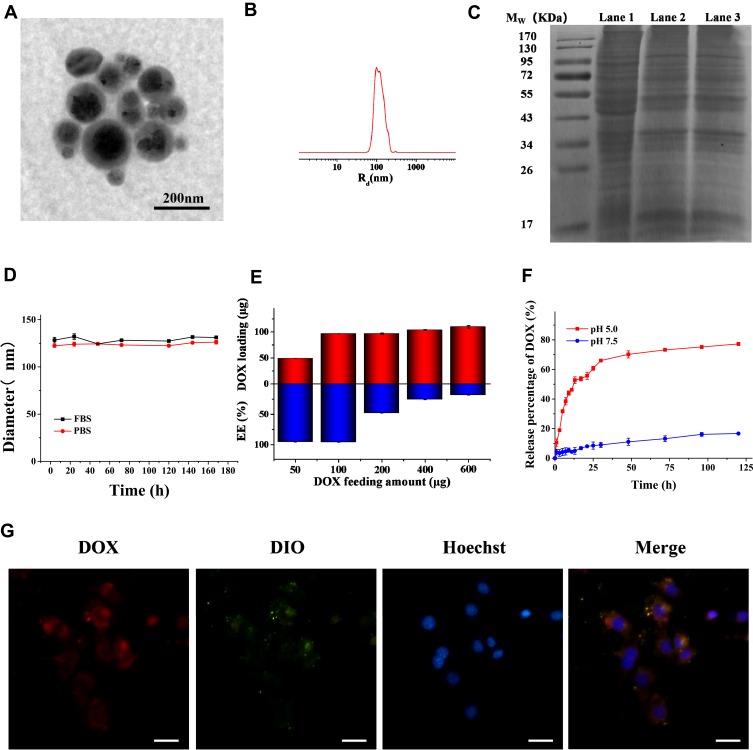
Figure 2.
Characterization of DOX-SPIO@MSCs. (A) TEM image and (B) particle size distribution of DOX-SPIO@MSCs. (C) The SDS-PAGE images of the gel after Coomassie blue staining. Lane 1: MSCs lysates, Lane 2: membrane vesicles, Lane 3: DOX-SPIO@MSCs. (D) The stability of DOX-SPIO@MSCs in FBS and PBS was evaluated by monitoring variation in particle size for different time intervals. (E) DOX loading amount and Encapsulation efficiency in 0.1 mg SPIO with different DOX feeding amounts. (F) The drug release profiles of the DOX-SPIO at different pH values. (G) Fluorescence microscope images of DOX-SPIO@MSCs illustrating colocalization of DOX@SPIO (DOX channel) and MSVs (DIO channel) after being internalized by MC38 cells. Scale bar=40μm.

