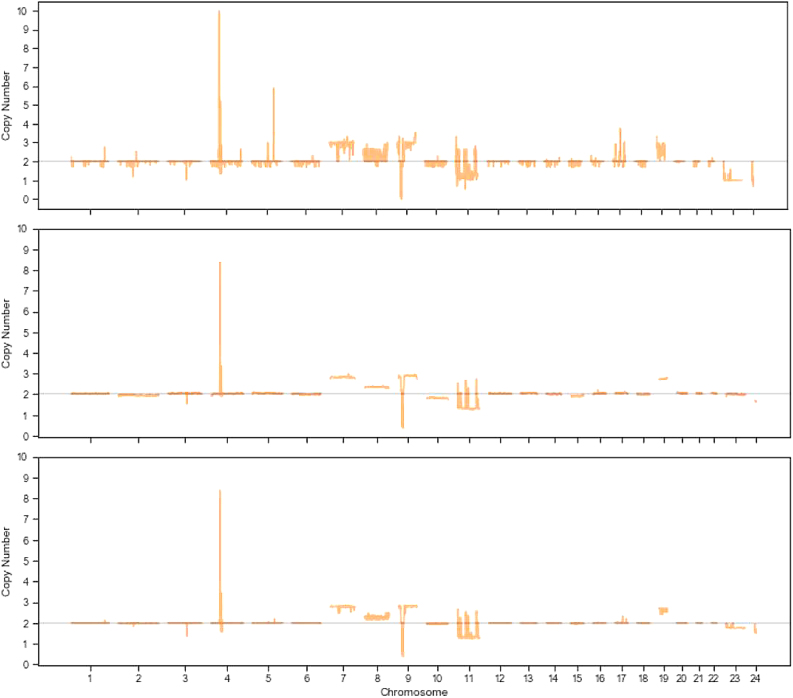
FIG. 19.
Average copy number aberration profiles for bulk tumor samples (top), all available single-cell data (center), and the inferred clones (bottom). The bulk data show considerable variability in aberrations, while the single-cell data are more stable. Our method infers clones that reflect events supported by bulk and/or single-cell data, allowing some reduction in noise. It also reduces the variation of averaging bulk samples and allows us to verify events in the single-cell data via support for similar events in the bulk data, addressing some of the noise problems of current SCS technologies. In each plot, the X-axis shows different numbered chromosomes, with chromosomes X and Y represented by 23 and 24. The Y-axis indicates the copy number.

