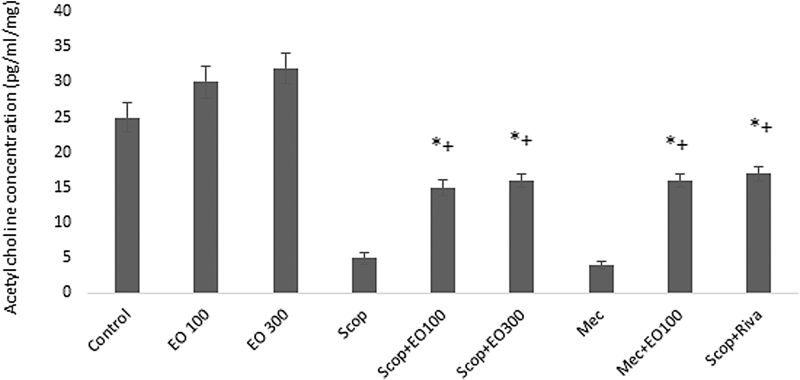
FIG. 7.
Comparison of Ach levels (pg/[mL·mg protein]) according to control in all groups. *P < .05 EO100 and 300 mg/kg; +P < .05 comparison of Ach levels according to scopolamine, mecamylamine, and their combinations with EO100 and 300 mg/kg and rivastigmine. Ach, acetylcholine; EO100, EO100 mg/kg; EO300, EO300 mg/kg.

