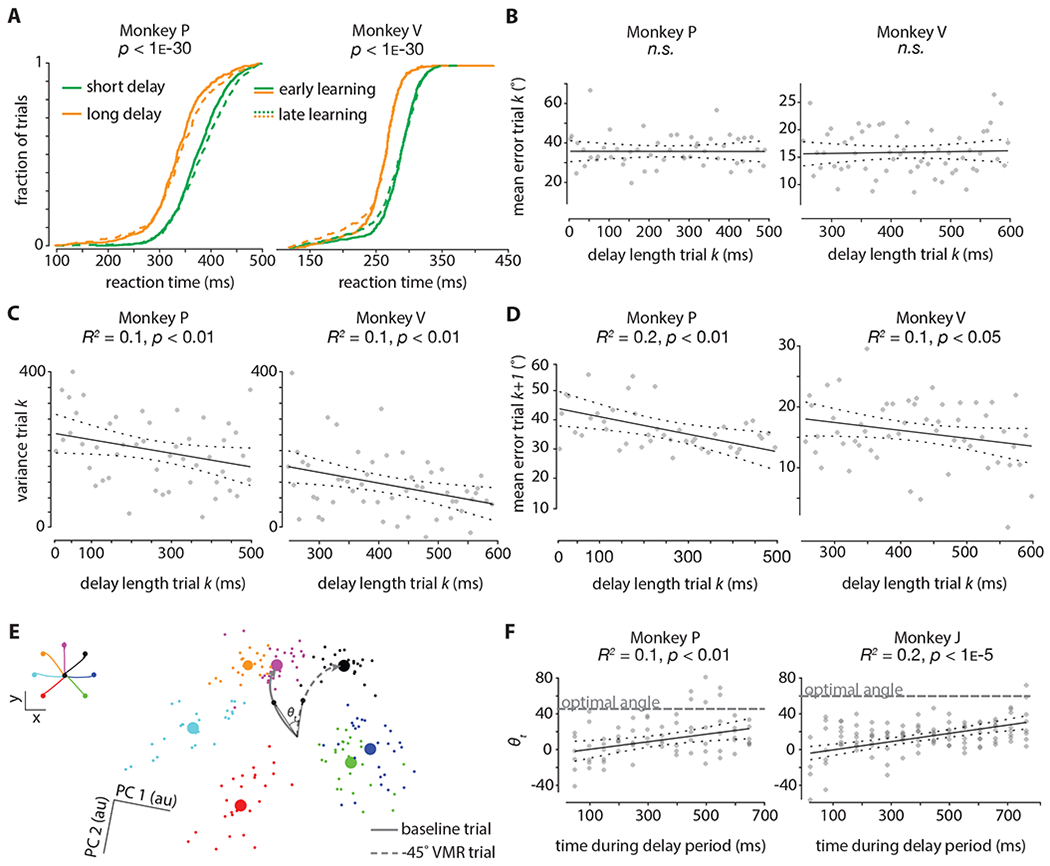
Figure 3: Longer preparation times yield greater learning.

A. Cumulative reaction time distributions (pooled across all sessions). Green denotes short delay periods (0-300ms), and orange denotes long delay periods (300-600ms). Dotted lines denote the first 150 trials during adaptation, and solid lines denote the last 150 trials during adaptation. The p-values were obtained from the Wilcoxon rank-sum test and compare trials with short delay periods and trials with long delay periods.
B. Correlation between the length of the delay period on trial k and the mean error on that same trial k. Data were binned in 50ms bins. The p-values are for the F-test on the model, which tests whether the fit is significantly better than a model with only a constant term. The plotted data (same for (C) and (D)) is pooled across five sessions; the first 25 trials (i.e., ‘early learning’) are considered from each session. The delay length for Monkey P was drawn randomly on every trial from a uniform distribution from 0ms-500ms; for Monkey V this was between 250ms-600ms.
C. Correlation between the length of the delay period on trial k and the variance in the distribution of errors (in 50ms bins) on that same trial k. The p-values are for the F-test on the model, which tests whether the fit is significantly better than a model with only a constant term. Delay period distribution was the same as in (B).
D. Correlation between the length of the delay period on trial k and the mean error (in 50ms bins) on the next trial k+1. The p-values are for the F-test on the model, which tests whether the fit is significantly better than a model with only a constant term. Delay period distribution was the same as in (B).
E. Delay period neural activity from a representative session projected into a 2D subspace found using Principal Components Analysis on 200ms of trial-averaged neural activity from a baseline block. Small dots are two-trial-averages projected into the subspace; large circles are cluster centroids. Colors correspond to the seven reach directions shown in the inset (top left). Gray lines correspond to hypothetical baseline and −45° VMR trial neural trajectories during the delay period; angle (θt) is computed between the trajectories for each time point t at a 10ms resolution.
F. The angle between neural trajectories during the delay period (θt) is computed at a 50ms resolution between baseline and −45° (−60° for Monkey J) VMR trajectories; each trajectory is a 5-trial average. The gray ‘optimal angle’ line corresponds to the ‘anti-VMR’ angle, i.e., 45° and 60° for Monkeys P and J respectively. Plotted is the correlation between the time during the delay period and the angle (θt) between trajectories. The p-values are for the F-test on the model, which tests whether the fit is significantly better than a model with only a constant term. The delay length for Monkey P was drawn randomly on every trial from a uniform distribution from 0ms-650ms; for Monkey J this was between 0ms-750ms. Data is pooled across sessions such that a population of at least 50 tuned neural units (channels on the Utah electrode arrays for Monkey J; channels on the V-probe for Monkey P) during early learning (first 25 trials) are analyzed. Note that data is shown for Monkey J, and not Monkey V, in this panel (see methods for details).
