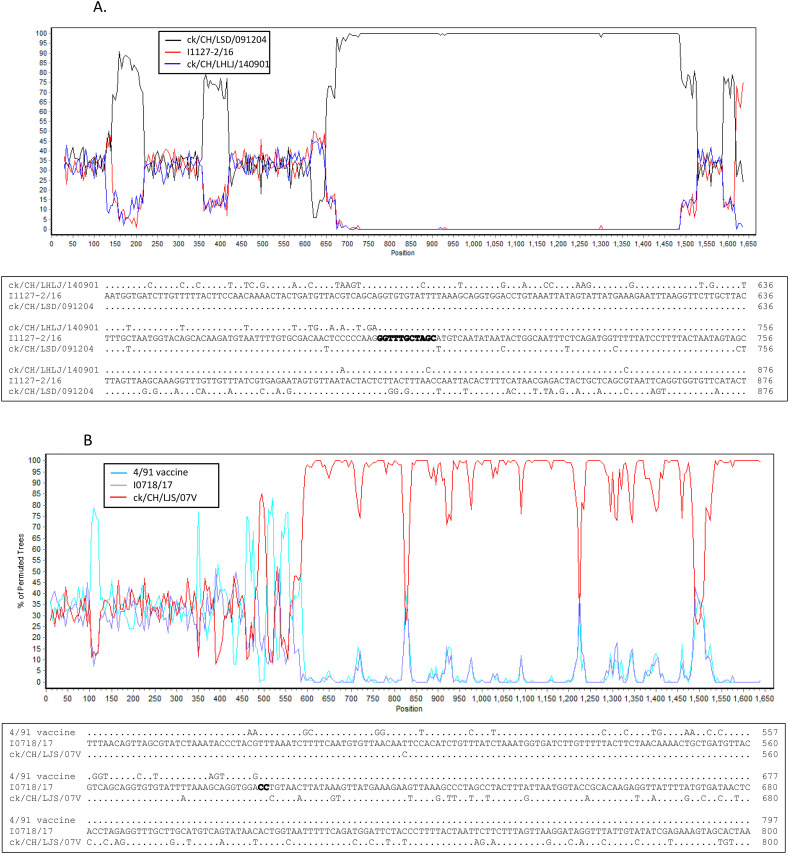
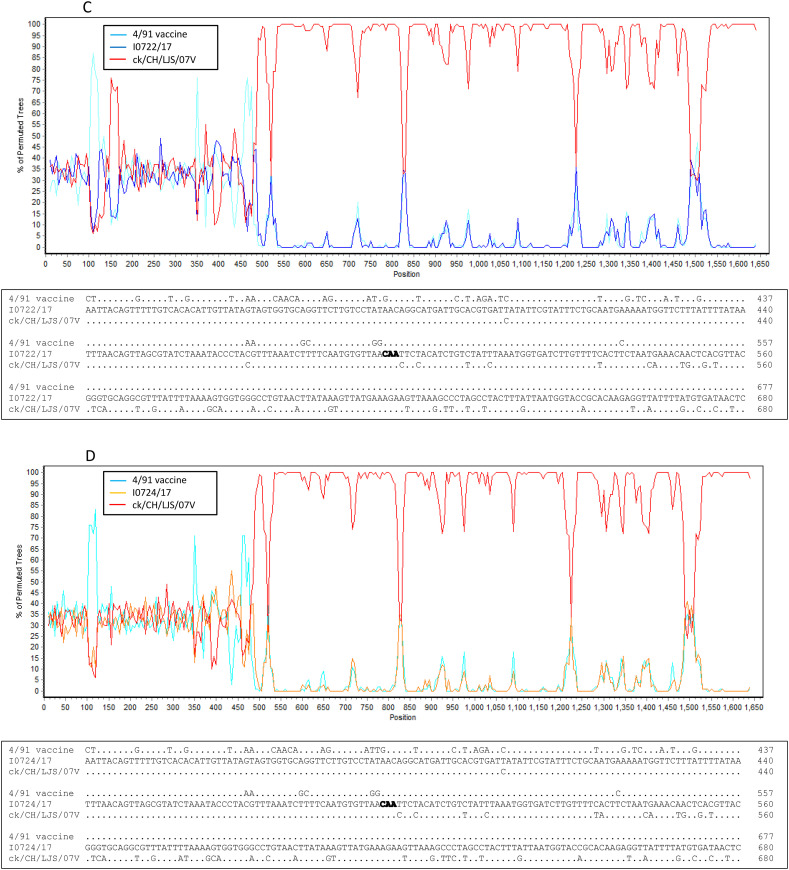
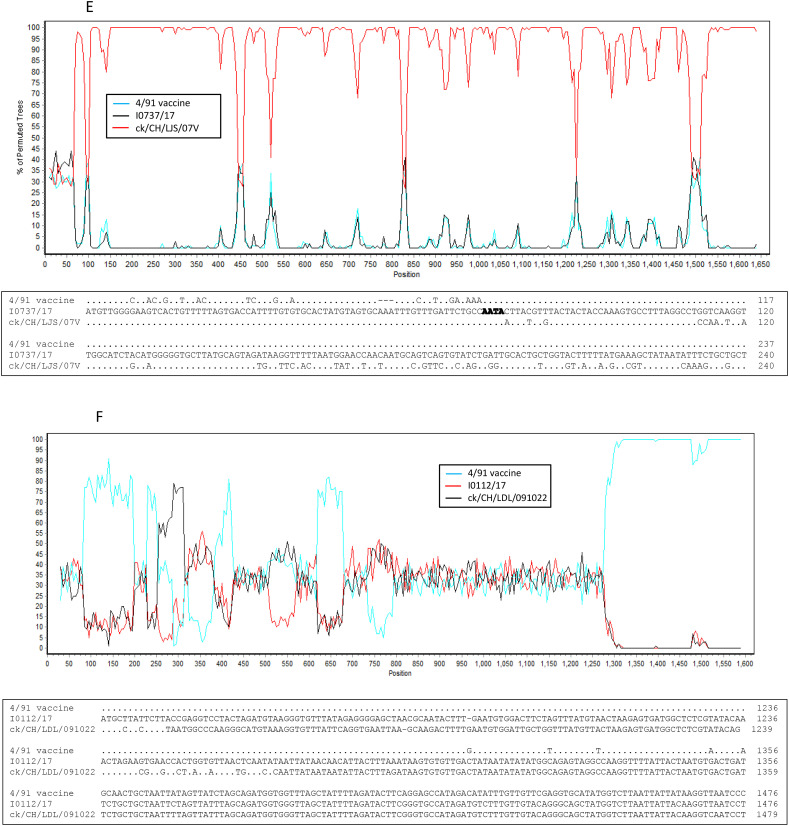
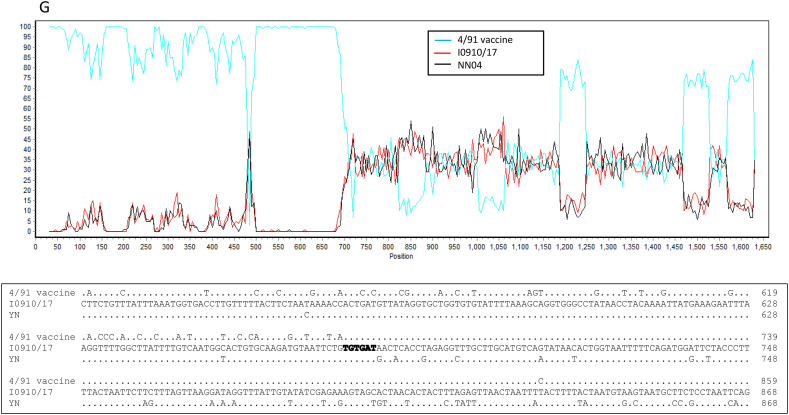
Fig. 4.
Bootscan analysis of S1 gene on the putative recombinant isolate and parental strains (upper parts in each figure), and sequence alignment of the recombination breakpoints and the flanking sequences between the putative recombinant isolate and parental strains (lower parts in each figure). Different reference strains were used as putative parental strains in each figure. Strain ck/CH/LSD/110347 was used as a query strain in Fig. 6A–F and strain ck/CH/LJS/101109 was used as a query strain in Fig. 6G. The y-axis shows the percentage of identity within a window size of 500 bp and a step size of 20 bp. Dots represent same base pairs, while letters show different base pairs. The GenBank accession numbers for these genome sequences are listed in Supplemental Table 2.


