
Fig. 1.
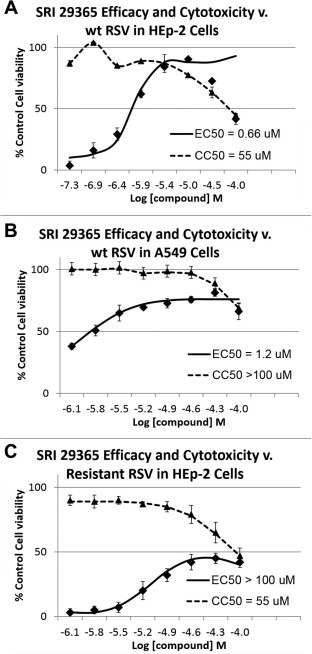
EC50 and CC50 plots for SRI 29365 in HEp-2 and A549 cells. EC50 and CC50 values were calculated for SRI 29365 against wt hRSV in either (A) HEp-2 cells or (B) A549 cells. In panel C, the concentration-dependent antiviral and cytotoxic responses were calculated for SRI 29365 against wt hRSV in HEp-2 cells. An eight point concentration dose response cytoprotection assay was performed (compound concentration range of 100–0.04 μg/mL) in the presence of hRSV-infected cells and the percent of cell viability (compared to uninfected, undrugged cell controls) was plotted v. test compound concentration (solid line). Each concentration point was performed in triplicate. In parallel, the same concentration range of test compound was added to uninfected cells to determine compound-induced cytotoxicity (dotted line). EC50/CC50 values were converted to Log M (molar) concentrations (x-axis). Dose–response curves were plotted, and EC50 values were calculated using IDBS’ XLfit function 205 [y = A + ((B − A)/(1 + ((C/x)^D)))] with minimum (A) and maximum (B) parameters set at 0 and 100 respectively.