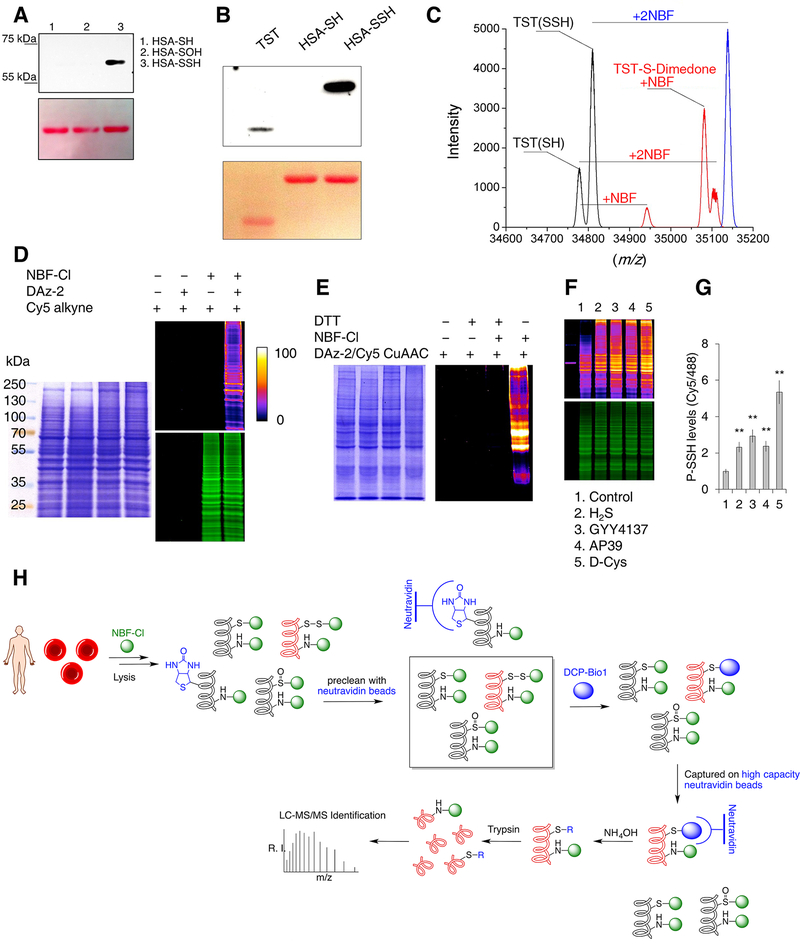
Figure 2. Protein persulfide labeling and identification.
(A-B) Selectivity of dimedone-switch method for protein persulfides. Human serum albumin (HSA, A) and TST (B) were used as models. Dimedone labeling was visualized by rabbit polyclonal anti-dimedone antibody. Ponceau S staining was used for the protein load.
(C) Deconvoluted mass spectra 20 μM rhodanese (black), rhodanese treated with 100 μM NBF-Cl (blue) and rhodanese treated first with 100 μM NBF-Cl then with 500 μM dimedone (red).
(D) In-gel detection of cellular PSSH levels. HeLa cells were lysed with or without supplementation of 10 mM NBF-Cl, and probed for persulfide labeling with or without DAz-2, followed by Cy5-alkyne using CuAAC. Gels were also stained with Coomassie Brilliant Blue. Fire pseudo-colouring was used to visually enhance the signal. Green fluorescence corresponds to the total protein load (NBF-protein adducts).
(E) MEF cells lysed with or without 20 mM NBF-Cl samples and then treated with or without 20 mM DTT and labeled with DAz-2/Cy5-alkyne using CuAAC.
(F-G) Protein persulfidation levels in HeLa cells treated with different H2S donors: 200 μM Na2S (H2S) for 45 min, 200 μM GYY4137 for 2 hr, 200 nM AP39 for 2 hr and 2 mM D-cysteine (D-Cys) for 1 hr. Ratio of Cy5/488 signals is used for the quantification (G). Data shown as a mean ± SD. of 3 individual experiments. ** p < 0.01 vs. control.
(H) Schematic depiction of the protocol used for the proteomic analysis of endogenous persulfidation in RBC.

