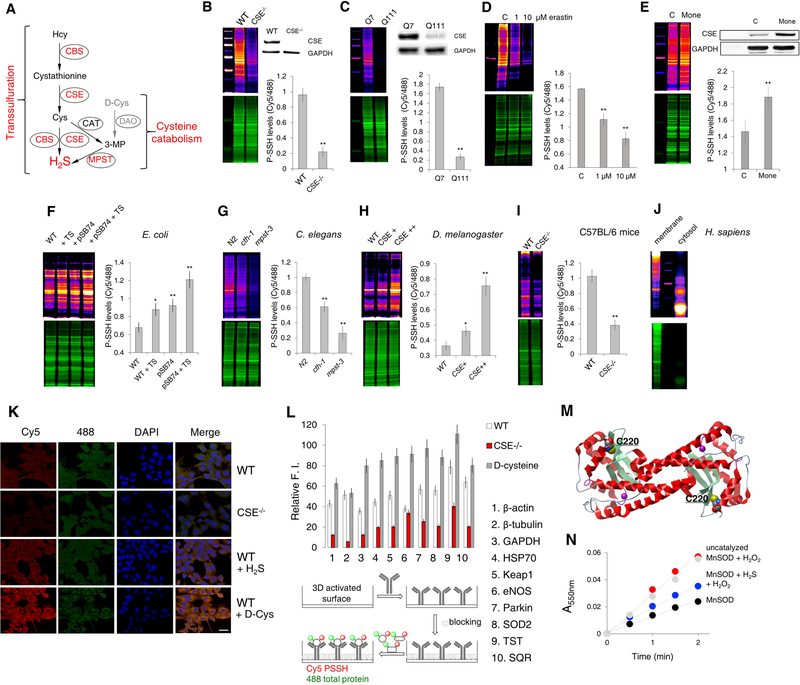
Figure 3. Intracellular persulfidation is evolutionarily conserved and controlled by H2S producing enzymes.
(A) Intracellular H2S production is catalyzed by cystathionine γ-lyase (CSE) and cystathionine-β-synthase (CBS), via the reverse transsulfuration pathway, and by 3-mercaptopyruvate sulfur transferase (MPST) in the cysteine catabolism pathway. Hcy: homocysteine; Cys: cysteine; 3MP: 3-mercaptopyruvate; CAT: cysteine aminotransferase; DAO: D-amino acid oxidase.
(B) PSSH levels in MEF cells from wild type (WT) and CSE−/− mice. Ratio of Cy5/488 signals is used for the quantification. n = 4. ** p < 0.01 vs. WT. Data are shown as mean ± SD. Inset: Western blot analysis of CSE levels. n = 3.
(C) PSSH levels in STHdhQ7/Q7 and STHdhQ111/Q111 cells. n = 4. ** p < 0.01 vs. Q7. Inset: Representative Western blot of CSE protein expression levels. n = 3.
(D) The effect of 1 and 10 μM Erastin (18.5 hr) on PSSH levels in WT MEF cells. n = 4. ** p<0.01 vs. control.
(E) PSSH levels in WT MEF cells for control, C, and treated with 1 μM Monensin, Mone (18 hr). n = 3. ** p<0.01 vs. control. Inset: Representative Western blot of CSE protein expression levels. n = 3.
(F) PSSH levels in E. coli without (WT) or with phsABC operon (pSB74 plasmid) that encodes thiosulfate reductase and results in H2S production. Both strains were treated with or without thiosulfate (TS, 4 hr at 37°C). n = 3. * p < 0.05, ** p < 0.01 vs. control.
(G) PSSH levels in wild type (N2), cth-1 and mpst-3 C. elegans mutants. ~ 16000 worms per sample. Ratio of Cy5/488 signals is used for the quantification. n = 3. ** p < 0.01 vs. control.
(H) PSSH levels in wild type (y1w118) Drosophila melanogaster and flies with different levels of CSE overexpression. 3–4 flies per samples. n = 3. * p<0.05, ** p<0.01 vs. WT.
(I) PSSH levels in kidney extracts form wild type (C57BL/6J) and CSE−/− mice. n = 3 animals. ** p < 0.01 vs. WT.
(J) Protein persulfidation in RBC membrane and cytosol from a healthy human donor.
(K) Confocal microscopy images of intracellular protein persulfide levels of WT and CSE−/− MEFs treated or not with 200 μM Na2S (H2S) or 2 mM D-Cys for 1 hr. Cy5 signal corresponds to protein persulfides, 488 nm signal corresponds to NBF-adducts. Nuclei stained with DAPI. Scale bar 20 μm.
(L) Antibody microarray-like approach to study persulfidation status of specific proteins. Schematic depiction of the method (lower part) and the actual readout (upper part) for the ten listed proteins. Cell lysates from WT, CSE−/− and WT MEFs treated with D-Cys (2 mM, 1 hr) were compared. Results are presented as a mean ± SD from 3 independent experiments.
(M) Ribbon structure of two subunits from human MnSOD (PDB: 1pl4), highlighting the cysteine residues and manganese containing active site.
(N) Persulfidation of MnSOD protects it from the H2O2-induced inactivation. SOD activity was measured using cytochrome c as a reporting molecule which is reduced by the superoxide generated from the xanthine/xanthine oxide system. Results are presented as a mean ± SD. from 3 independent experiments.

