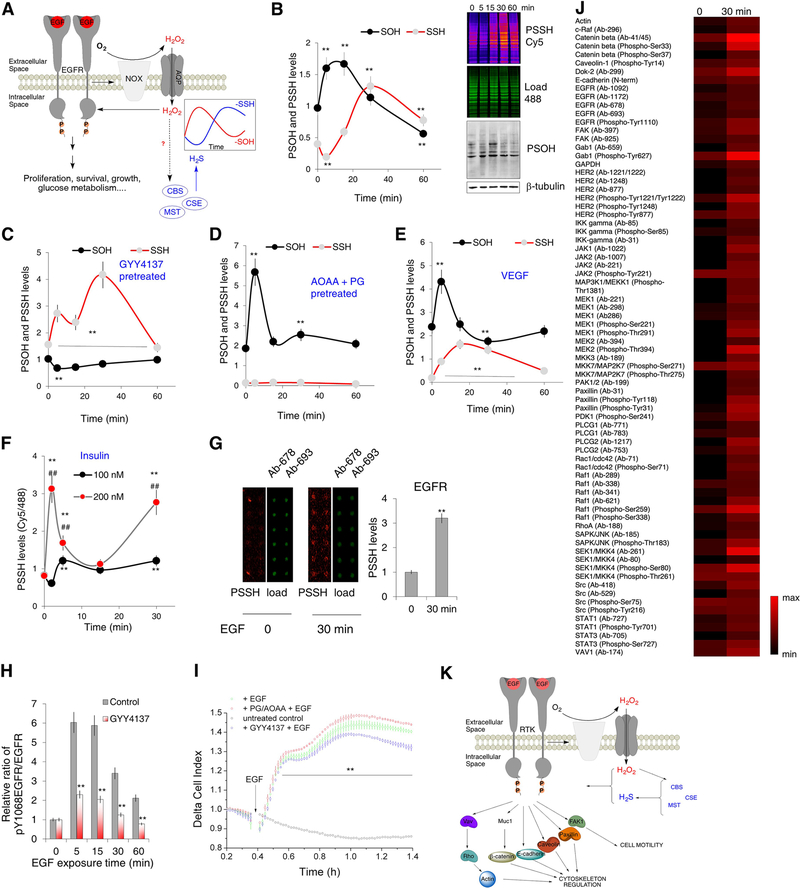
Figure 5. Waves of protein persulfidation in RTK signaling.
(A) Schematic representation of the signaling events triggered by the epidermal growth factor receptor (EGFR) activation. Nox: NADPH oxidase; AQP: aquaporin.
(B) HeLa cells treated with 100 ng/mL EGF for 5, 15, 30 or 60 min were analyzed for protein sulfenylation (labeled using DCP-Bio1 and visualized with streptavidin-488, levels calculated using β-tubulin as a loading control) and protein persulfidation (using dimedone switch method with Cy5 as a reporting molecule, levels calculated as a ratio of Cy5/488 fluorescence readouts). (Top) In-gel fluorescence of PSSH levels and Western blots for PSOH levels. (Bottom) Temporal dynamics of PSSH and PSOH changes upon EGF exposure. n ≥ 3. Values are presented as a mean ± SD. ** p < 0.01 vs. control (0).
(C) Quantification of PSSH and PSOH changes as a function of time upon EGF exposure in HeLa cells, pretreated with GYY4137 (100 μM) for 30 min, prior the EGF treatment. n ≥ 3. Values are presented as a mean ± SD. ** p < 0.01 vs. control.
(D) Quantification of PSSH and PSOH changes as a function of time upon EGF exposure in HeLa cells, pretreated with 2 mM mixture of inhibitors, aminooxyacetic acid (AOAA) and propargylglycine (PG) (1:1, 30 min), prior the EGF treatment. n ≥ 3. Values are presented as a mean ± SD. ** p < 0.01 vs. control.
(E) Quantification of PSSH and PSOH changes in HUVEC as a function of time upon VEGF (40 ng/mL) exposure. n ≥ 3. Values are presented as a mean ± SD. ** p < 0.01 vs. control.
(F) The effect of different insulin concentrations on PSSH levels in neuroblastoma (SHSY5Y) cells as a function of time of insulin exposure. n ≥ 3. Values are presented as a mean ± SD. ** p < 0.01 vs. untreated, ## p < 0.01 100 nM vs. 200 nM.
(G) Persulfidation of EGF receptor of HeLa cells treated with 100 ng/mL EGF for 30 min, detected by two different antibodies using antibody microarray slides. Each antibody was spotted in pentaplicated. 2 technical replicates were performed. Values are presented as a mean ± SD. ** p < 0.01 vs. untreated (0).
(H) Time-dependent phosphorylation of EGF receptor tyrosine 1068 (Y1068) as a response to EGF. HeLa cells were pretreated or not with GYY4137 (100 μM) for 2 hr prior to exposure to EGF (100 ng/mL). n = 3. ** p < 0.01 GYY4137 treated vs untreated.
(I) Real-time measurement of EGF receptor activation in living cells recorded with xCELLigence RTCA DP system. HeLa cells were also pretreated with GYY4137 (100 μM, 30 min) or with 2 mM mixture of AOAA and PG (1:1, 30 min). EGF receptor activation was initiated by the addition of 150 ng/mL EGF. n = 4. Values are presented as a mean ± SD. ** p < 0.01 vs. untreated control.
(J) Antibody microarray analysis of persulfidation of different kinases involved in the EGF signaling. HeLa cells were treated with 100 ng/mL EGF for 30 min. Each antibody was spotted in pentaplicated. 2 technical replicates were performed.
(K) Schematic presentation of protein targets involved in actin remodeling, cytoskeleton regulation and cell motility, found to be persulfidated in cells treated with 100 ng/mL EGF for 30 min.

