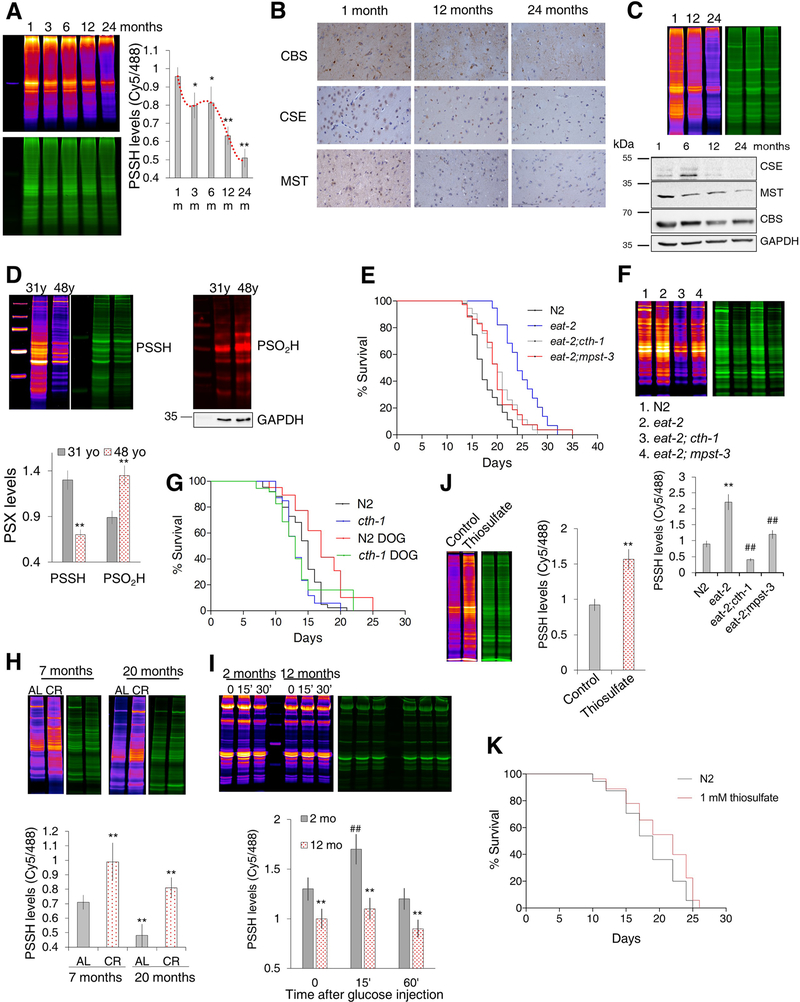
Figure 7. Anti-aging properties of protein persulfidation.
(A) Changes in the persulfidation levels in brain extracts of male Wistar rats 1, 3, 6, 12 and 24 months of age, calculated as a ratio of Cy5/488 signal. Values are presented as a mean ± SD. n = 3/age group. * p < 0.05, ** p < 0.01 vs 1 month (1m).
(B) Immunohistochemical analysis of CSE, CBS and MST expression levels in the cortex of 1-, 12- and 24-month-old male Wistar rats. Images are representative of 3 animals/experimental group, magnification 20x.
(C) Protein persulfidation levels of 1-, 12- and 24-month-old hearts of male Wistar rats (top). Expression levels of CSE, CBS and MPST in hearts of 1-, 6-, 12- and 24-month-old male Wistar rats (bottom). Images are representative of 3 animals/experimental group.
(D) PSSH and PSO2H levels in human fibroblasts originating from the same donor but collected at the age of 31 and 48. Quantification of thiol modifications, marked on y axis as PSX, represents average ± SD of n = 3. ** p < 0.01 vs. 31 yr.
(E) Survival curves for N2, eat-2, eat-2;cth-1 and eat-2; mpst-3 double mutants. n > 100 per line. N2 = 17.8±0.5 days; eat-2 = 24.5±0.9 days; eat-2;cth-1 = 20.3±0.6 days; eat-2;mpst-3 = 20.2±0.7 days. For eat-2;cth-1 vs. eat-2 and eat-2;mpst-3 vs. eat-2 p < 0.001.
(F) Persulfidation levels in N2, eat-2, eat-2;cth-1 and eat-2; mpst-3 C. elegans mutants. Values are presented as average ± SD. Protein extracts from ~16000 worms were used for each lane. n = 3. ** p < 0.01 vs. N2, ## p < 0.01 vs. eat-2.
(G) Survival curves for N2 and cth-1 mutants grown in the absence or presence of 5 mM 2-deoxy-D-glucose (DOG). n = 110 per each line. N2 = 14.2±0.4 days, N2 5 mM DOG = 17.2 ± 1.0 days; cth-1 = 13.3 ± 0.4 days; cth-1 5 mM DOG = 13.7 ± 1.0 days. For N2 vs. N2 5 mM DOG p= 0.005; for cth-1 vs. cth-1 5 mM DOG p = n.s, for N2 vs. cth-1 p = 0.0565.
(H) Age-induced PSSH changes in 7- and 20- month-old mice fed ad libitum (AL) and mice fed with calorie restriction diet (CR). n = 5 animals per group. ** p < 0.01 vs. 7-month AL mice.
(I) Time-dependent PSSH changes in the muscle tissue of 2- and 12- month old male mice injected i.p. with D-glucose (2 g/kg body weight). n ≥ 3 animals per group. ** p < 0.01 control vs. 2-month old mice, ## p<0.01 2-month vs. 12month old mice.
(J) Persulfidation levels in N2 worms with and without treatment of 1 mM thiosulfate. n = 3. ** p < 0.01 vs. control.
(K) Survival curves for N2 C. elegans, and N2 treated with 1 mM thiosulfate. n > 160 per group. N2 = 18.5 ± 0.3 days, 1 mM thiosulfate = 20.3 ± 0.4 days. p < 0.0001

