
Fig. 4.
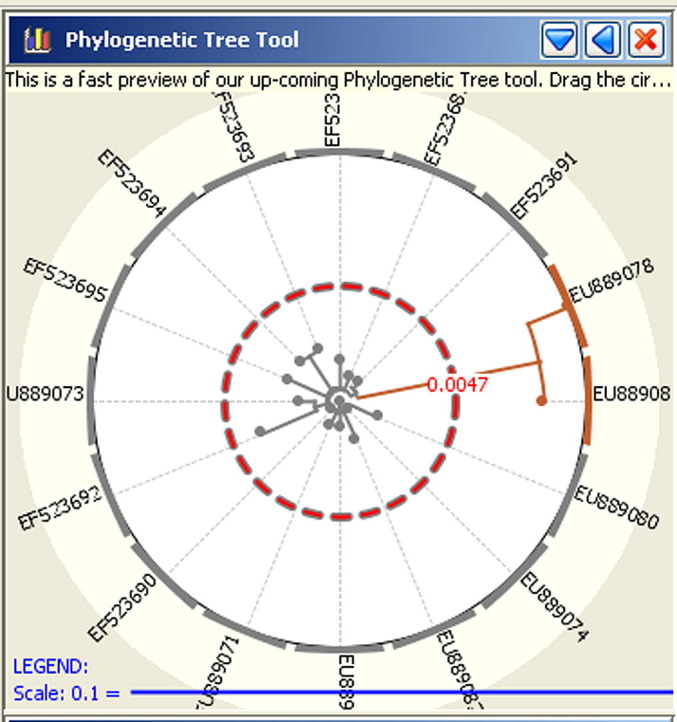
Phylogenetic tool from the Disease BioPortal (http://www.fmdbioportal.ucdavis.edu/) applied to the combined pool of 8 Danish and 8 Swedish H5N1 highly pathogenic avian influenza viruses. Users may change the value of genetic distance that is used as a threshold (red circle) to categorize isolates as “similar” and “different”, which are depicted in the tree and in the spatial visualizer using colors specific for each category (orange and gray in the example hear). Here, the tree was built using a neighboring joining algorithm; users may also implement maximum likelihood and maximum parsimony algorithms. (For interpretation of the references to color in this figure legend, the reader is referred to the web version of this article.)