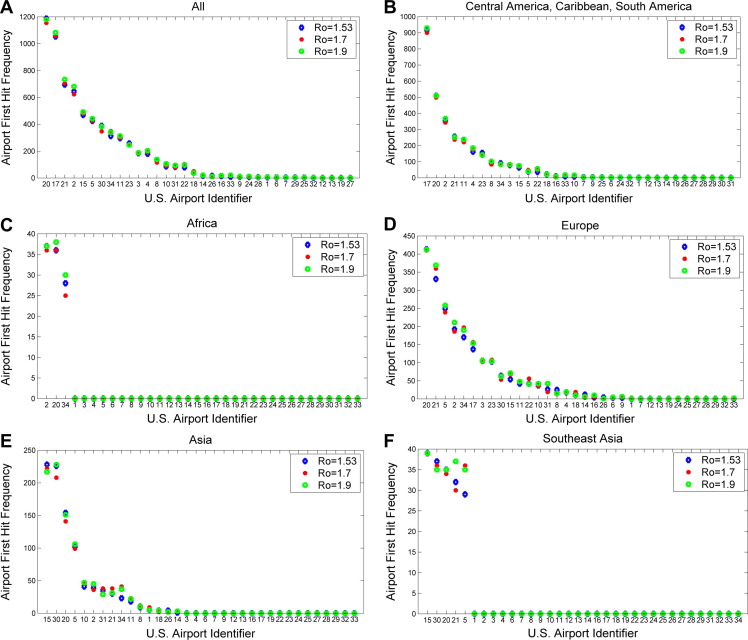
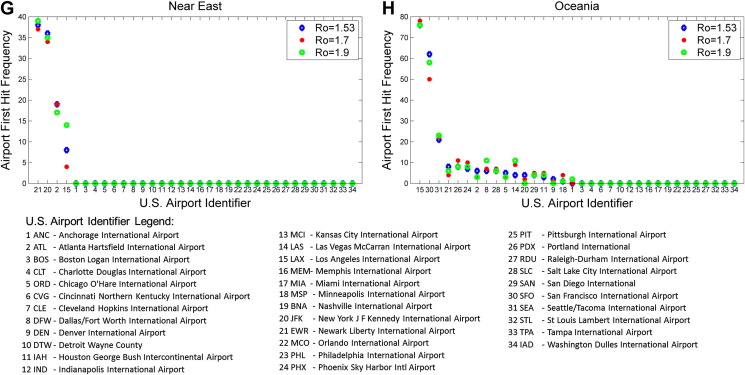
Figure 4.
Airport first hit frequency. Calculations were based on the number of times a given airport was an entry point for any of the first 10 symptomatically infectious passengers over the course of all simulation trials. Analysis of simulation results for three reproduction numbers (1.53 in blue, 1.7 in red, and 1.9 in green) are presented according to world regions. (A) When considering all infectious disease origination points, analysis indicates that JFK (New York) would experience the earliest impact followed by MIA (Miami), EWR (Newark), ATL (Atlanta), LAX (Los Angeles), ORD (Chicago), SFO (San Francisco), and others. (B) For Central and South American disease origination points, MIA would experience the earliest impact followed by JFK, ATL, EWR, and IAH (Houston). (C) For African disease origination points, ATL and JFK would experience the earliest impact followed by IAD. (D) For European disease origination points, JFK and EWR would experience the earliest impact, followed by ORD, ATL, IAD (Washington), MIA and others. For (E) Asian and (F) Southeast Asian disease origination points, LAX and SFO would experience the earliest impact followed by JFK, ORD, EWR and others. For (G) Near East disease origination points, EWR and JFK would experience the earliest impact followed by ATL and LAX. For (H) Oceania disease origination points, LAX would experience the earliest impact followed by SFO, and others.


