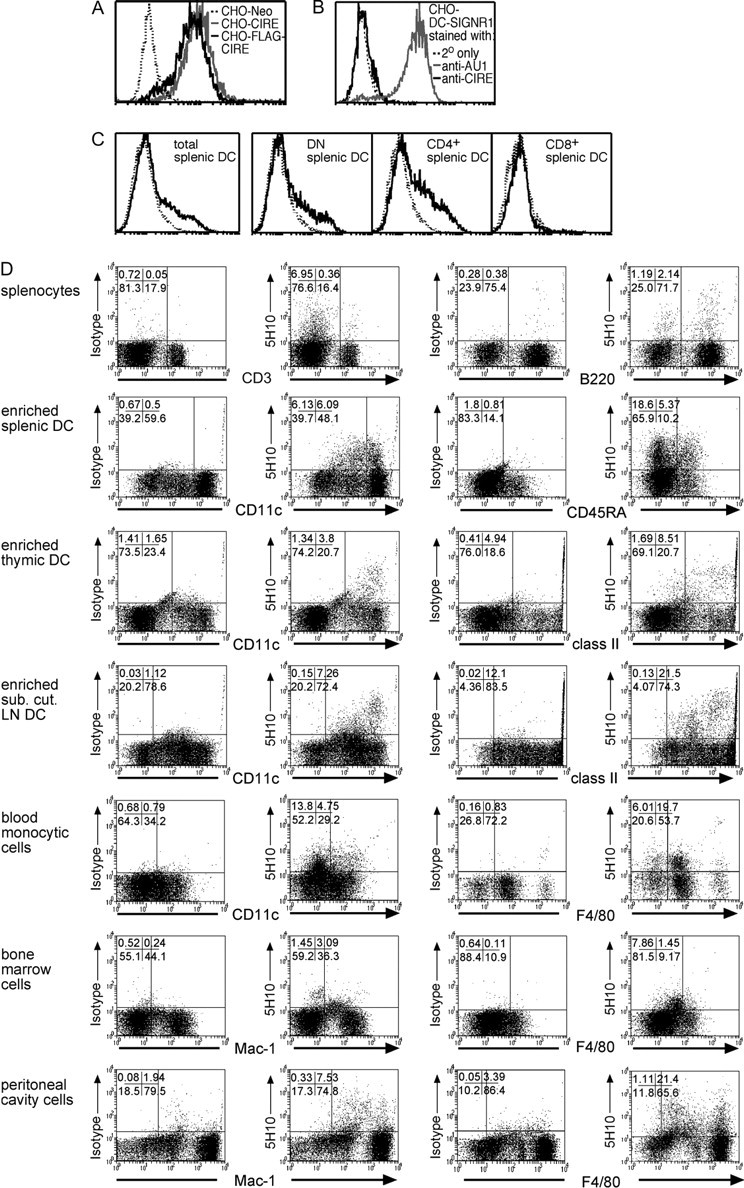
Fig. 1.

Cytofluorometric analysis of CIRE/mDC-SIGN expression. (A) CHO cells expressing FLAG-CIRE/mDC-SIGN (CHO-FLAG-CIRE), CIRE/mDC-SIGN (CHO-CIRE) or the neomycin resistance gene alone (Neo-CHO) were stained with anti-CIRE/mDC-SIGN mAb and counterstained with goat anti-rat FITC antibody. (B) CHO expressing mouse SIGNR1 (where mouse SIGNR1 was genetically fused to express the AU1 sequence) was stained with 5H10. (C) Splenic DCs from SPF mice were isolated and identified by high forward light scatter and staining with anti-CD11c-Cy5. DCs were further stained with anti-CD4–Alexa and anti-CD8–FITC. Only in the samples depicted in panel C was the staining intensity for CIRE/mDC-SIGN amplified using Flow-Amp. The continuous line represents the anti-CIRE/mDC-SIGN staining on gated cells and the dotted line represents staining of isotype control antibody. Histographs are on a four-decade logarithmic scale. (D) Bone marrow cells, blood monocytes, peritoneal cavity cells, splenocytes, splenic cDCs, splenic pDCs, LNs–DCs and thymic DCs were isolated from germ-free mice. DCs were stained using anti-CD11c–FITC, anti-CD45RA–FITC or anti-class II (M5/114-FITC). Other cell types were stained with anti-F4/80–FITC, anti-CD3 (KT3-1.1-FITC), anti-B220 (RA3-6B2-FITC) and anti-Mac-1 (M1/70-FITC). Cells were stained using anti-CIRE/mDC-SIGN–biotin mAb, then detected in flow cytometry using streptavidin–PE. The CIRE/mDC-SIGN staining seen on transfectants (panel A) and primary cells (panel D) was not amplified using Flow-Amp. Percentages of cells in respective quadrants are displayed in the upper left corner.
